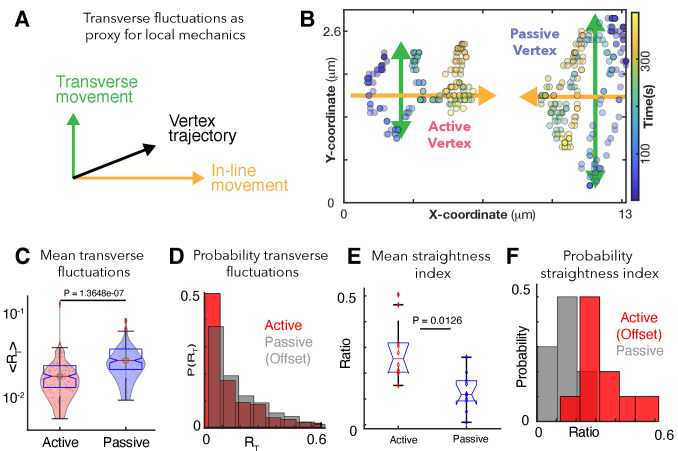
Figure 3. Patterns of transverse vertex fluctuations reveal mechanical heterogeneity of active and passive vertices in vivo.
(A) Schematic of transverse fluctuations in the vertex position perpendicular to the direction of junction shortening; traverse movements are extracted using the transverse 'hop' function, which is inversely proportional to the local vertex stiffness (Appendix, Section 12). (B) X/Y coordinates for a representative pair of active and passive vertices color coded for time, with transverse (green) and in-line (orange) motion indicated. (C) Mean transverse fluctuation , for active and passive vertices. (N=20 vertices; 10 embryos over 386 seconds; t-test p value shown). (D) Probability distribution of transverse fluctuations, , (offset for clarity). (E) Straightness index quantifying the persistence of vertex motion in terms of directionality (Appendix, Section 12); t-test p value is shown. (F) Probability distribution of the straightness index for active (red, offset for clarity) and passive (blue) vertices.

