Figure 10.
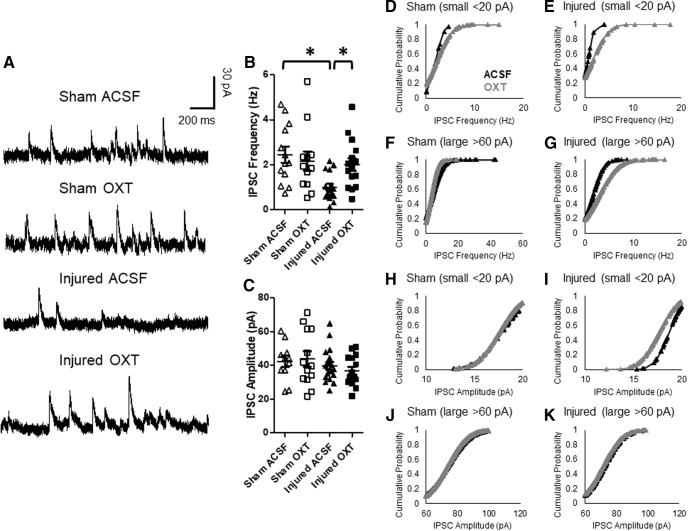
OXT increased the frequency of spontaneous IPSCs in Layer II/III neurons within the mPFC. A, Representative traces of spontaneous IPSCs recorded from Layer II/III pyramidal neurons within the mPFC. B, Frequency of spontaneous IPSCs. C, Amplitude of spontaneous IPSCs. Bars represent group mean value, and error bars represent SEM. Cumulative probability of small IPSC frequencies in sham (D) and injured cells (E). F, G, Cumulative probability of large IPSC frequencies in sham (F) and injured cells (G). Cumulative probability of small IPSC amplitudes in sham (H) and injured cells (I). Cumulative probability of large IPSC amplitudes in sham (J) and injured cells (K; Ryan et al., 2016; Douglas, 2020). Open triangles represent sham cells bathed with aCSF (N = 13), open squares represent sham cells bathed with 1 μm OXT (N = 12), filled triangles represent injured cells bathed with aCSF (N = 17), filled squares represent injured cells bathed with 1 μm OXT (N = 15); *p < 0.05.

