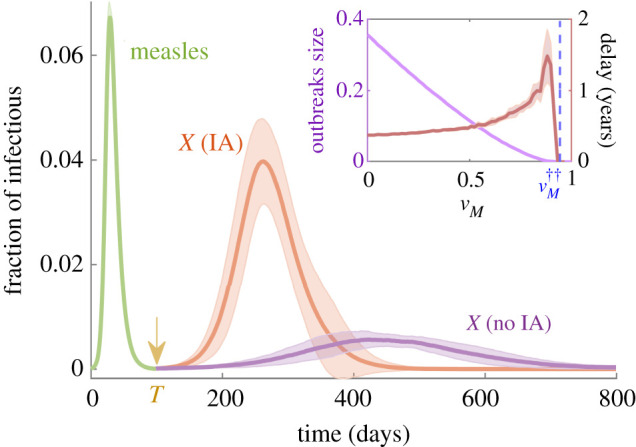
Figure 2.

Time evolution of the fraction of: (i) M-infectious individuals (green curve), (ii) X-infectious individuals in the absence of IA (purple), and (iii) X-infectious individuals under the presence of IA effects (orange). X-vaccination coverage was set slightly over its herd-immunity threshold , with ɛ = 0.001. Conversely, was set to guarantee the spreading of measles outbreaks. At time T = 100 days, a seed of X-infectious individuals was inserted into the system. In the inset, we plot the maximum size of the X outbreak (measured as the total fraction of infectious individuals integrated in time) and the time elapsed between the green and orange peaks (in years) against M-vaccination coverage. The blue-dashed line marks the theoretical approximation to the vaccination threshold (see equations (A 30) and (A 31) in appendix A). Simulations were performed within the mean-field, homogeneous-mixing approximations, using the Gillespie algorithm with a total population size N = 105. Shaded areas around the curves indicate one standard deviation, as determined from over 50 independent runs. Parameters were chosen according to table 1.
