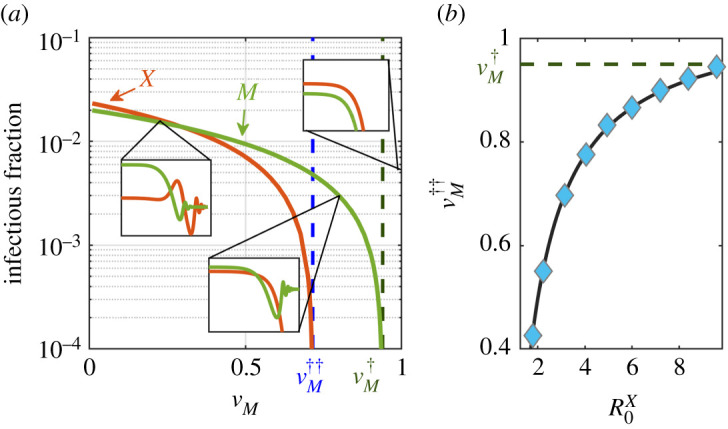
Figure 4.

Analysis of the stationary states and epidemic thresholds in the SIR-IA with demography. (a) Stable stationary state for the X-infectious (orange line) and M-infectious (purple line) population fractions as a function of the measles vaccination coverage vM (vanishing values in the disease-free steady states are not shown). Blue and green dashed lines mark the analytically found critical points and , respectively, according to equation (3.10). In the insets, we illustrate the time evolution (in days) of the X-infectious (orange) and M-infectious (green) population fractions for the three different regimes found in figure 6. Curves were obtained by direct integration of equations (3.1a)–(3.1h). (b) Minimum fraction of M-vaccinated individuals, , necessary to prevent an endemic state of disease X as a function of the reproduction number . The black curve represents the theoretical approximation for according to equation (3.10), while blue markers correspond to the numerical solutions obtained by studying the fixed points of the system and their stability (see Methods). All parameters were chosen according to table 1.
