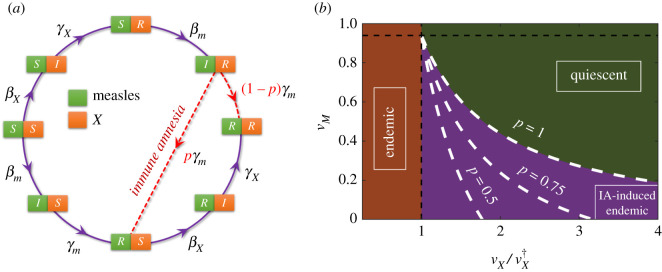
Figure 8.
Analysis of the extended version of the model in which immune amnesia effects occur only with some probability. (a) Sketch of transitions between all possible states. As in the main text, green (orange) cells correspond to measles (X) disease states, and demographic processes are not included. (b) Analytically determined phases for the X disease in the extended SIR-IA model for the case with demography on homogeneous networks. The white-dashed lines which would separate in each case the quiescent and IA-induced endemic states were determined through equation (B 6) for different values of the probability p.

