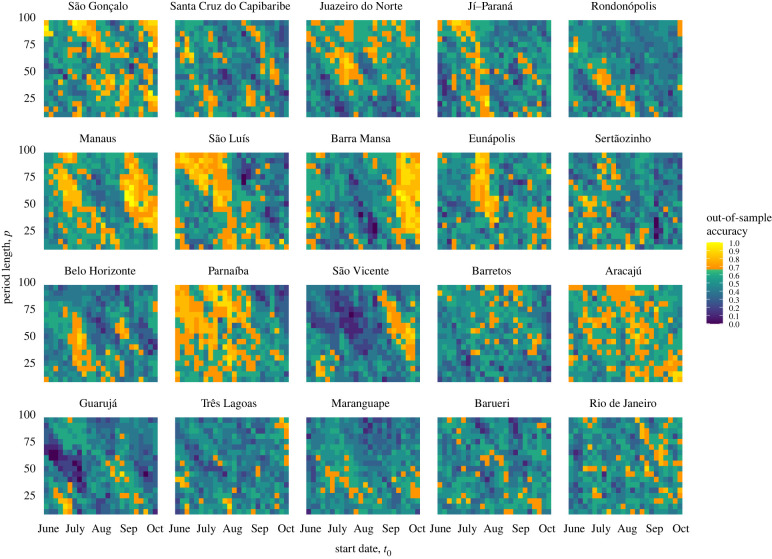
Figure 2.
The 10 year (2008–2017) out-of-sample forecast accuracy (%) for each time window of temperature and precipitation, by the municipality. The x-axis (t0) indicates the start date of the time interval, and the y-axis (p) indicates the length of the time interval from which weather data were gathered (10–95 days). Models achieving at least 7/10 correct out-of-sample forecasts are shown in shades of yellow. Municipalities are ordered by decreasing ensemble prediction accuracy; that is, the proportion of years correctly forecast by the ensemble method over the years 2012–2017.

