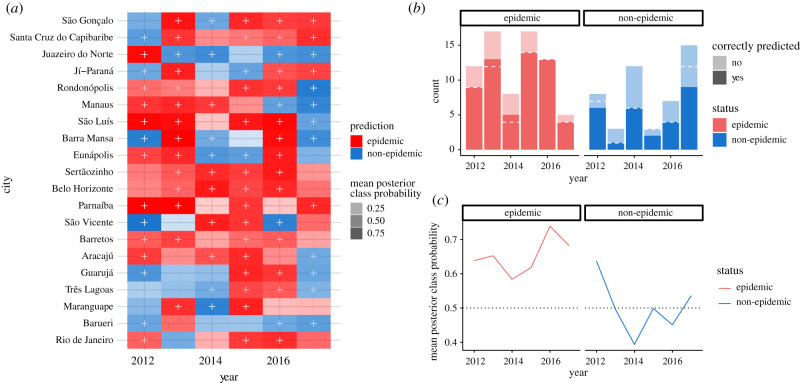
Figure 3.
Weather-based prediction results for 120 municipality years. (a) Annual out-of-sample forecasts of outbreak status (epidemic/non-epidemic) for 20 Brazilian municipalities from 2012 to 2017, shaded by the mean posterior probability of the true outbreak status. Correct forecasts are indicated by a plus (+) sign, and cells with light shading indicate that the model predicted the class with low probability. Municipalities are ordered by decreasing ensemble prediction accuracy; that is, the proportion of years correctly forecast by the ensemble method over the years 2012–2017. (b) The number of total epidemic and non-epidemic years correctly forecast across 20 municipalities, by year. The dashed white line indicates the number correctly forecast after the incorporation of empirically observed dengue cycles. (c) The mean posterior class probability across municipalities, by year and epidemic status.

