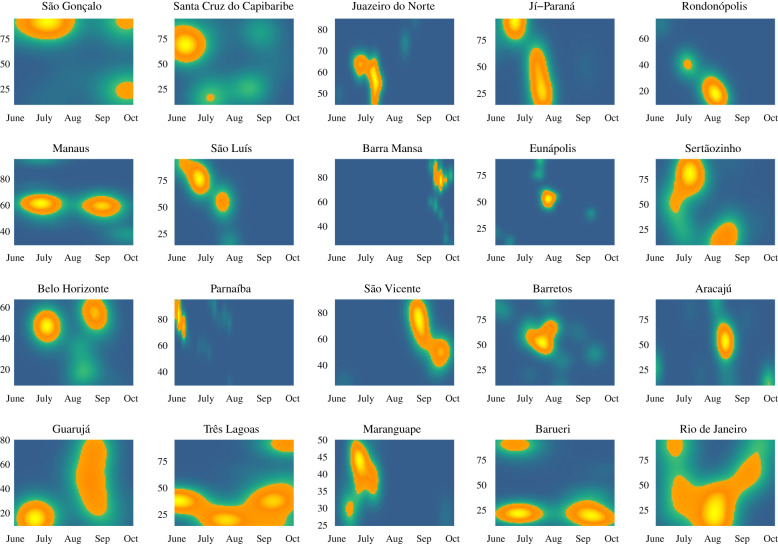
Figure 4.
Periods of the year selected into the ensemble forecast model for 2012–2017, by the municipality. The x-axis (t0) indicates the start date of the time interval, and the y-axis (p) indicates the length of the time interval from which weather data were gathered (10–95 days). Municipalities with smaller and brighter yellow centres are those which exhibit the highest consistency in the predictive performance of weather patterns. Municipalities are ordered by decreasing ensemble prediction accuracy; that is, the proportion of years correctly forecast by the ensemble method over the years 2012–2017.

