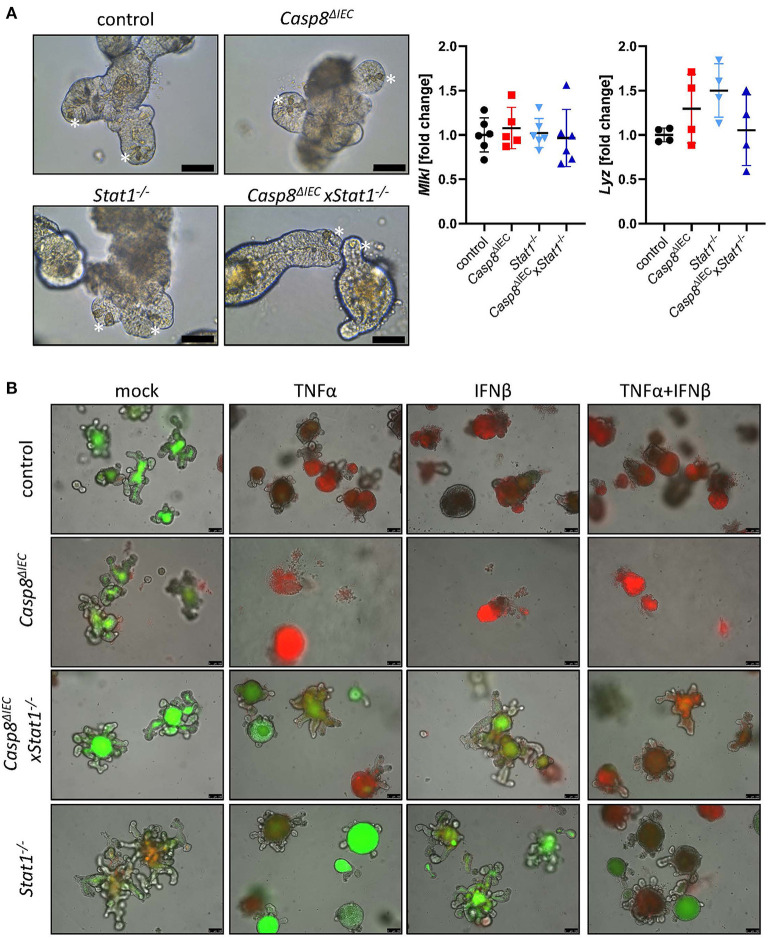
Figure 2.
STAT1 coordinates interferon induced cell death in vitro. (A) Representative pictures of organoids derived from of control, Casp8ΔIEC, Stat1−/− and Casp8ΔIECxStat1−/− mice. (Scale bar: 50 μm, Paneth cells marked with asterisks). Gene transcription analysis of organoid mRNA expression. Gapdh was used as housekeeping gene. Gene expression levels are shown as fold changes. Error bars indicate +/-SD. (B) Organoids derived from of control, Casp8ΔIEC, Stat1−/− and Casp8ΔIECxStat1−/− mice. Stimulated with TNFα (25 ng/ml) and IFNβ (100 ng/ml) were stained with propidium iodide (red, dead cells) and live cells visualized by autofluorescence (green; scale bar: 100 μm).

