Figure 3.

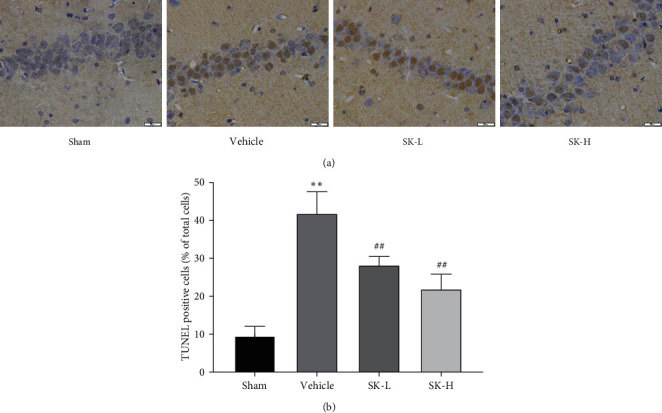
(a) TUNEL staining shows apoptotic cells in the CA1 region of hippocampus. Scale bar = 20 μm. Magnification: 400x. (b) Quantitative analysis of the data from TUNEL staining (n = 6) (mean ± SD, n = 6 in each group). ∗∗p < 0.01 vs. sham group; ##p < 0.01 vs. vehicle group.
