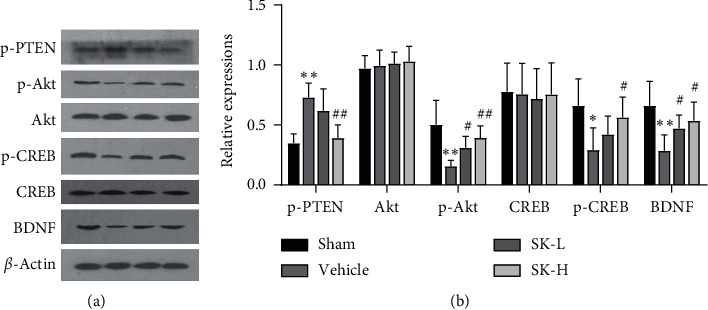
Figure 5.

(a) Representative western blots of p-PTEN, Akt, p-Akt, CREB, p-CREB, and BDNF. β-actin served as the control for protein loading. (b) Quantitative analysis of the western blot data (n = 6) (mean ± SD, n = 6 in each group). ∗p < 0.05, ∗∗p < 0.01 vs. sham group; #p < 0.05, ##p < 0.01 vs. vehicle group.
