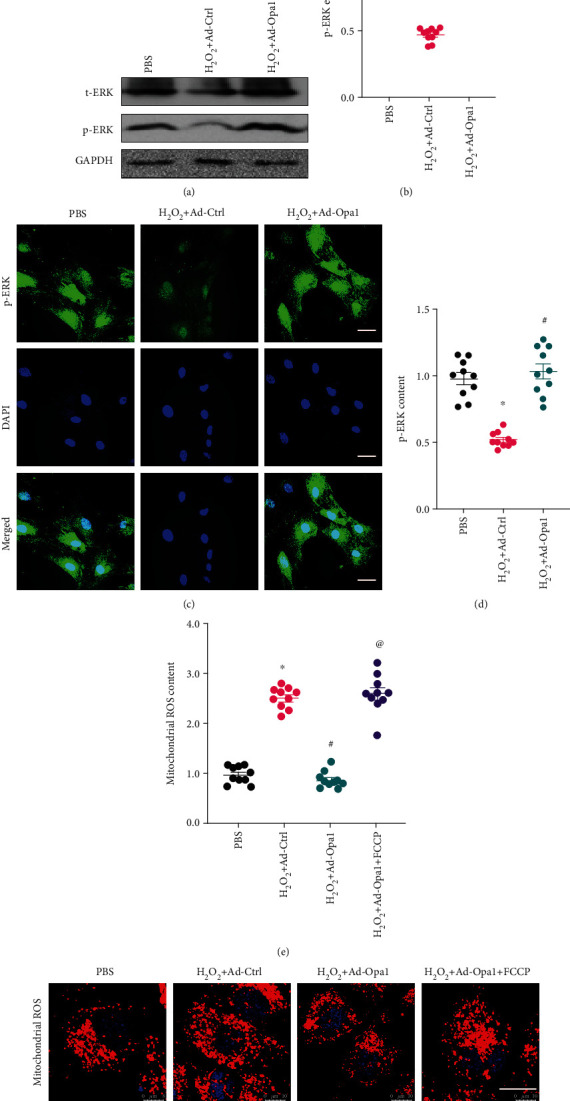
Figure 5.

Opa1-mediated mitophagy activates the MAPK/ERK signaling pathway. Control (nontransduced) and Ad-Opa1-transduced H9C2 cardiomyocytes were treated with 0.3 mM H2O2 for 12 h. (a, b) Western blotting analysis of ERK and p-ERK expression. (c, d) Analysis of ERK and p-ERK expression through immunofluorescence. Bar: 75 μm. (e, f) Fluorescent detection of ROS production in cells pretreated with the MAPK/ERK inhibitor PD98059. Bar: 25 μm. ∗p < 0.05 vs. control group, #p < 0.05 vs. H2O2+Ad-Ctrl group, @p < 0.05 vs. H2O2+Ad-Opa1 group.
