Figure 1.

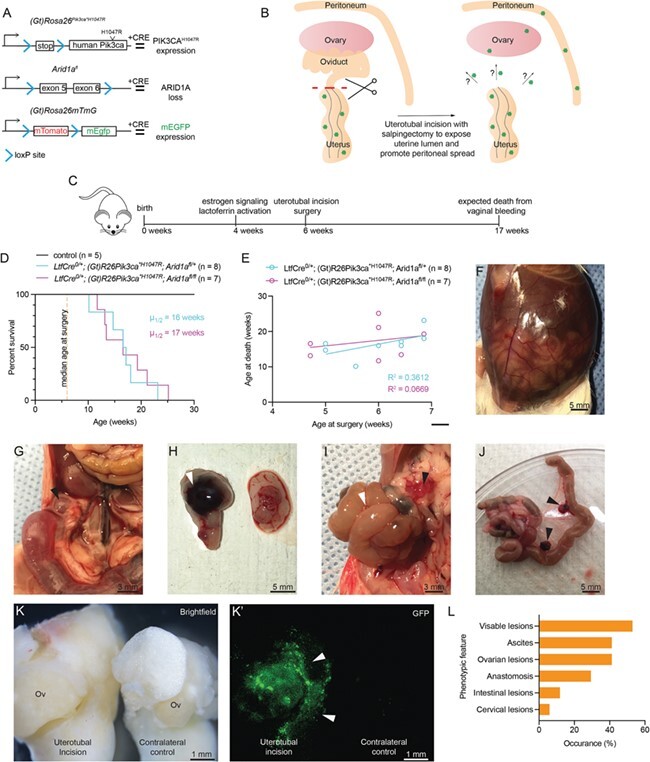
LtfCre 0/+ ; (Gt)R26Pik3ca *H1047R ; Arid1a fl/+ and LtfCre 0/+ ; (Gt)R26Pik3ca *H1047R ; Arid1a fl/fl mice develop ovarian lesions, anastomosis and ascites following salpingectomy. (A) Diagram depicting mouse alleles used in this study. ARID1A, AT-rich interactive domain-containing protein 1A; PIK3CA, phosphatidylinositol-4,5-bisphosphate 3-kinase, catalytic subunit alpha; mEGFP, mouse enhanced green fluorescent protein. (B) Schematic representation of uterotubal incision and salpingectomy surgery. (C) Timeline for experimental mouse model. (D) Survival of mice following surgery. Survival was based on vaginal bleeding and other endpoints (see Table II). Control mice were aged for 1 year (n = 9, black line). No difference in survival was observed between LtfCre0/+; (Gt)R26Pik3ca*H1047R; Arid1afl/+ (n = 8, blue line) and LtfCre0/+; (Gt)R26Pik3ca*H1047R; Arid1afl/fl (n = 9, purple line) mice following surgery (P = 0.7421, unpaired t test, two-tailed). (E) Age at surgery vs. age at death. No significant relationship was observed (P = 0.1151 for LtfCre0/+; (Gt)R26Pik3ca*H1047R; Arid1afl/+, blue line; P = 0.3584 for LtfCre0/+; (Gt)R26Pik3ca*H1047R; Arid1afl/fl, purple line Pearson’s). (F) Example of LtfCre0/+; (Gt)R26Pik3ca*H1047R; Arid1afl/fl mice with ascites following surgery. (G) Ovarian cysts are observed in animals 6 weeks post-salpingectomy on the ipsilateral ovary. Arrow indicates cyst. (H) Example of animal with hemorrhagic ‘chocolate cyst’ endometrioma on ovary ipsilateral to incision. Arrow indicates lesion. (I) Intestinal obstruction in mutant mice following surgery. White arrows denote intestines, black arrows denote omental metastasis. (J) Intestinal anastomosis following salpingectomy. Black arrows denote omental lesions. (K) Bright-field image and fluorescent green image (K′). EGFP fluorescence denotes Cre + endometrial epithelium on or near the ovary. Ov: ovary. (L) Histogram compiling observational data upon necropsy.
