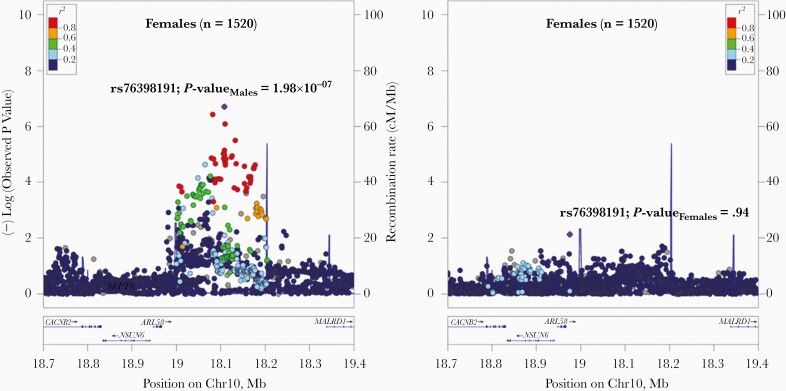
Figure 2.
Locus zoom plot presenting the results of the fixed-effects multiancestry meta-analysis in Chr10p12.31 region in males and females. Each point represents a single-nucleotide polymorphism (SNP) passing quality control plotted with its P value for males or females as a function of genomic position (Genome Reference Consortium Human genome build 37 assembly). The lead SNP is represented by the purple symbol. The color coding of all other SNPs indicates linkage disequilibrium with the lead SNP estimated by r2 values for European populations of the 1000 Genomes Project (red, r2 ≥ 0.8; gold, 0.6 ≤ r2 < 0.8; green, 0.4 ≤ r2 < 0.6; cyan, 0.2 ≤ r2 < 0.4; blue, r2 < 0.2; gray, r2 unknown). Abbreviations: ARL5B, adenosine diphosphate–ribosylation factor–like 5B; CACNB2, calcium voltage-gated channel auxiliary subunit beta 2; NSUN6, NOP2/Sun RNA methyltransferase 6; MALRD1, MAM and LDL receptor class A domain containing 1.

