
Figure 1.
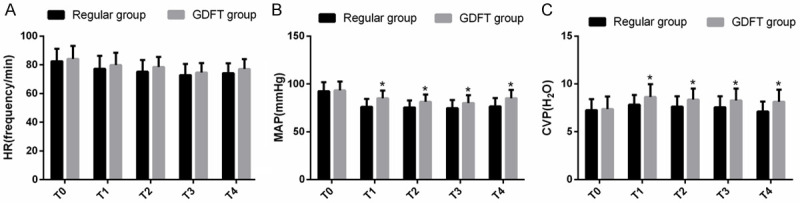
Comparison of hemodynamic indexes. A. Comparison of HR between the two groups at different time points. B. Comparison of MAP between the two groups at different time points. C. Comparison of CVP between the two groups at different time points. Note: * means that compared with routine group, P < 0.05.