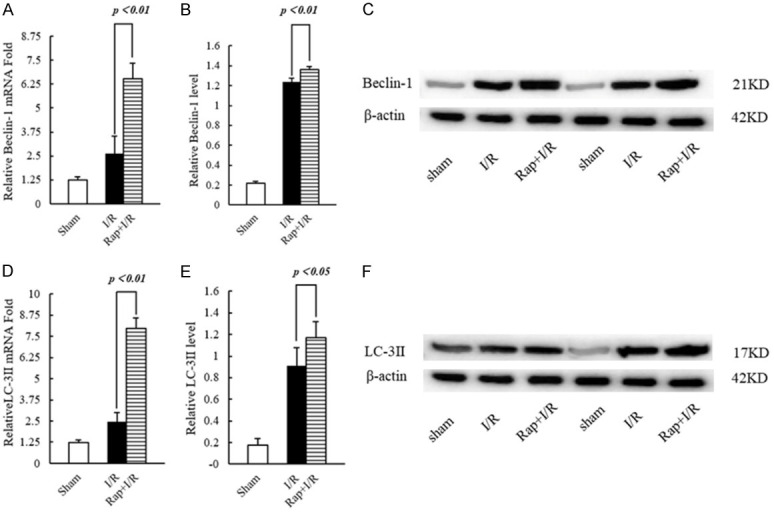
Figure 5.

The transcription and expression of beclin-1 and LC-3ll in rat brain tissue. A. Statistics of the transcription level of beclin-1. B. Statistics of the protein expression level of beclin-1. C. Representative Western blotting image of beclin-1. D. Statistics of the transcription level of LC-3ll. E. Statistics of the protein expression level of LC-3ll. F. Representative Western blotting image of LC-3ll.
