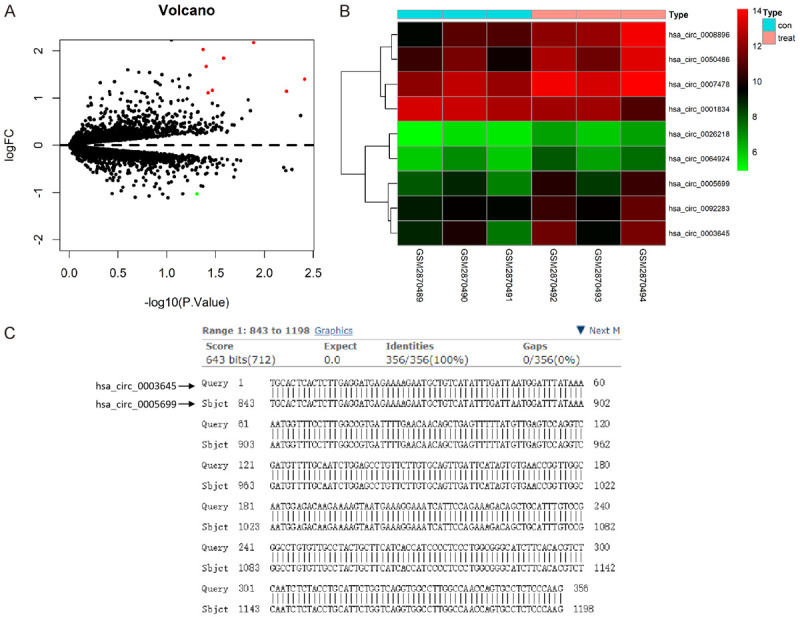
Figure 2.

Identification of DECs associated with atherosclerosis in the GEO database. A. Volcano plot of detectable DECs associated with atherosclerosis from the GSE107522 dataset analyzed by R software with the limma package loaded. Red plots stand for up-regulated circRNAs, and green ones represent down-regulated circRNAs with |log2FC| >1 and P<0.05. The black plots indicate nonsignificant genes. The abscissa shows the -log10 of the adjusted p-value for each gene, indicating the strength of the association. The ordinate presents the FC in circulating the gene expression between the samples and control. B. Heat map of DECs as analyzed by pheatmap. C. The nucleic acid sequences of hsa_circ_0003645 and hsa_circ_0005699, derived from circBase database (http://www.circbase.org/), were compared. DECs, differentially expressed circRNAs; GEO, gene expression omnibus; FC, fold change.
