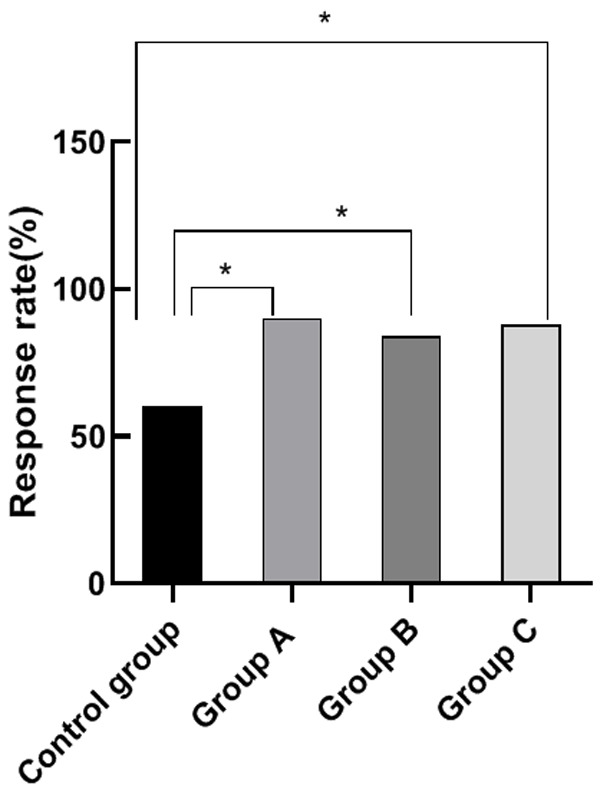
Figure 1.

Comparison of treatment efficiency. Note: The horizontal axis stands for the groups, and the vertical axis stands for treatment efficiency. From left to right, the treatment efficiency of the four groups respectively is 60%, 90%, 84%, and 88%. a, comparison between the control group and group A (x2=12.00, P=0.001) (P<0.05). b, comparison between the control group and the group B, (x2=7.14, P=0.008) (P<0.05). c, comparison between the control group and the group C, (x2=10.19, P=0.001) (P<0.05).
