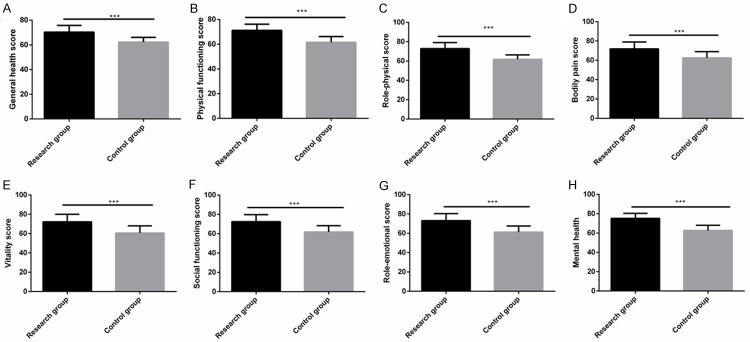
Figure 6.
Comparison of life quality between the two groups. A. The general health score of the research group was significantly higher than that of the control group. B. The physiological functioning score of the research group was significantly higher than that of the control group. C. The role physical score of the research group was significantly higher than that of the control group. D. The bodily pain score of the research group was significantly higher than that of the control group. E. The vitality score of the research group was significantly higher than that of the control group. F. The social functioning score of the research group was significantly higher than that of the control group. G. The emotional function score of the research group was significantly higher than that of the control group. H. The mental health score of the research group was significantly higher than that of the control group. Note: *** indicates P<0.001.

