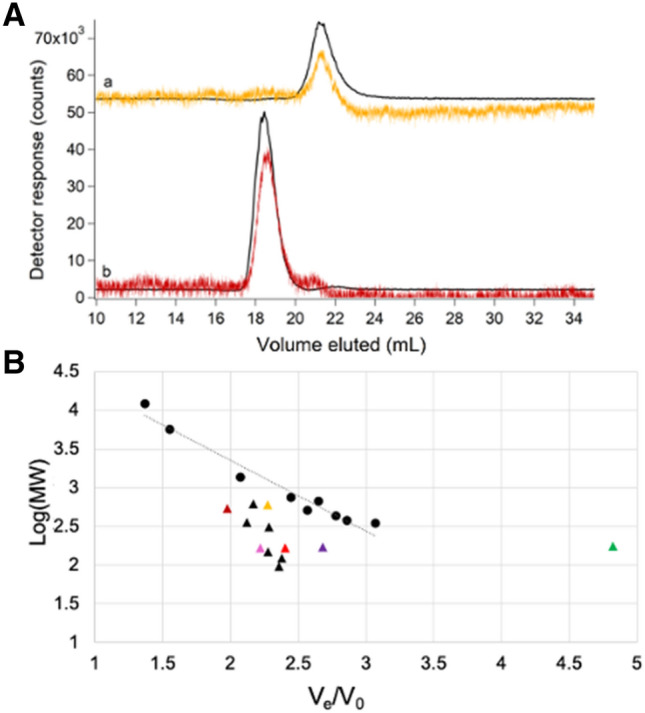
Fig. 4.

Chromatograms of [Fe(phen)3]2+ (orange) and [Fe(BPY)3]2+ (red) (a) and deviations from expected molecular mass trend line (B). A: (a) 2 µM FeSO4 + 20 µM phen detected by iron ICP-MS (black, ÷ 1.33) and at 510 nm (orange, × 104); (b) 2 µM FeSO4 + 20 µM BPY detected by iron ICP-MS (black, ÷ 2) and at 523 nm (red, × 104). B: Molecular mass calibration curve and trendline (log(MM) = − 0.9204(Ve/V0) + 5.1971; R2 = 0.9575) using standards from Table S1 (circles) and a Zn-loaded single column. Deviant standards are shown as triangles. [Fe(phen)3]2+ and [Fe(BPY)3]2+ are color-coordinated to UV–Vis traces in A. Aqueous metal standards were Zn acetate (green), FeSO4 (bright red), MnCl2 (pink) and NiSO4 (purple)
