Fig. 1.
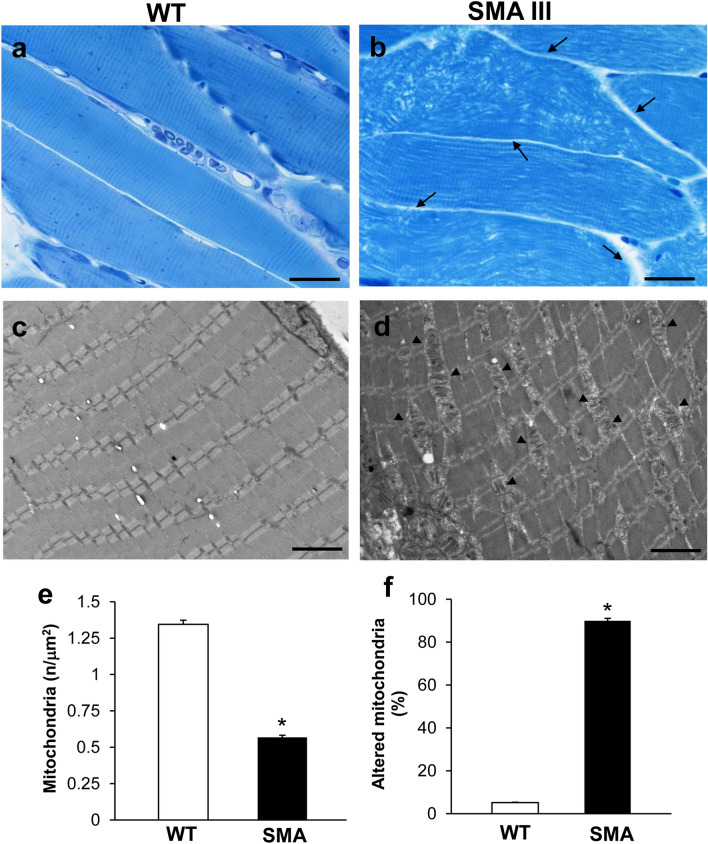
Muscle fiber architecture and sub-cellular structures are altered in SMA compared with WT mice. a, b Representative pictures at light microscopy of methylene- and toluidine blue-stained semi-thin sections from gastrocnemius muscle in WT and SMA mice. WT mice a show a regular, longitudinal, and parallel arrangement of aligned muscle fibers with the typical banding pattern. Nuclei at the periphery of the fibers are well visible. Muscle from SMA mice b shows unparalleled and disarranged fibers and myofibrils, with the space among fibers appearing enlarged (arrow). c, d Representative TEM micrographs of gastrocnemius muscle from WT and SMA mice. WT mice c show well-arranged myofibrils with the typical pattern of dark and light bands. No ultrastructural alterations are detected, and a geometrical alignment of sarcomeres is evident. Muscle from SMA mice d shows several disarranged areas with a significant increase in intersarcomeric area containing altered, swollen mitochondria (arrowhead). e, f Graphs report the amount of mitochondria expressed as mitochondrial density (number of mitochondria/μm2), and the number of altered mitochondria expressed as a percentage of total mitochondria in SMA and WT mice. Values are the mean number ± S.E.M. from 20 homogenous areas each measuring 6 μm2. Scale bar: a, b = 50 µm; c, d = 3.5 µm. *P ≤ 0.05 compared with WT.

