Fig. 2.
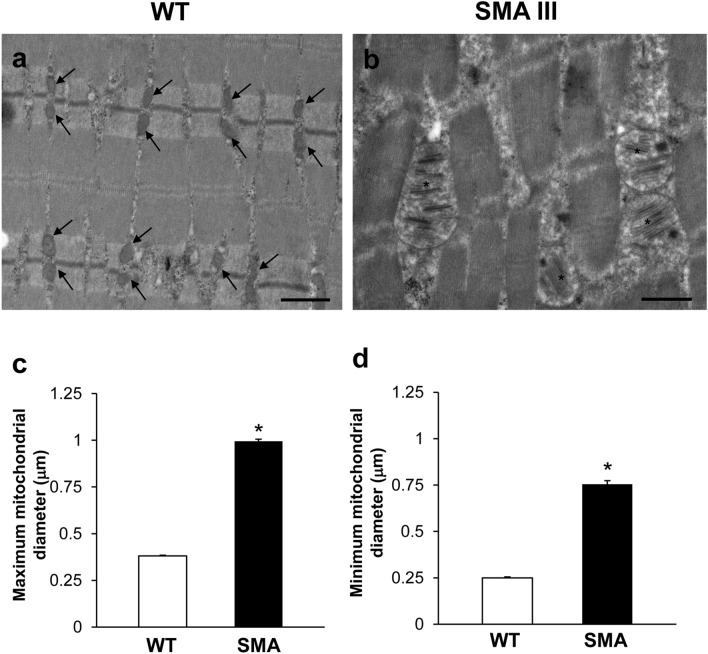
Pathological mitochondrial swelling occurs in the muscle of SMA mice. a, b Representative TEM micrographs at higher magnification showing mitochondria in gastrocnemius muscle from WT and SMA mice. WT mice a show a normal pattern of mitochondria (arrows). SMA mice b show altered, swollen mitochondria with enlarged cristae (asterisk). c, d Graphs report the maximum (c) and minimum (d) mitochondrial diameter measured within the muscle of SMA compared with WT mice. Values are the mean number ± S.E.M. of 50 mitochondria per mouse (500 mitochondria per group). Scale bar: a, b = 1 µm. *P ≤ 0.05 compared with WT

