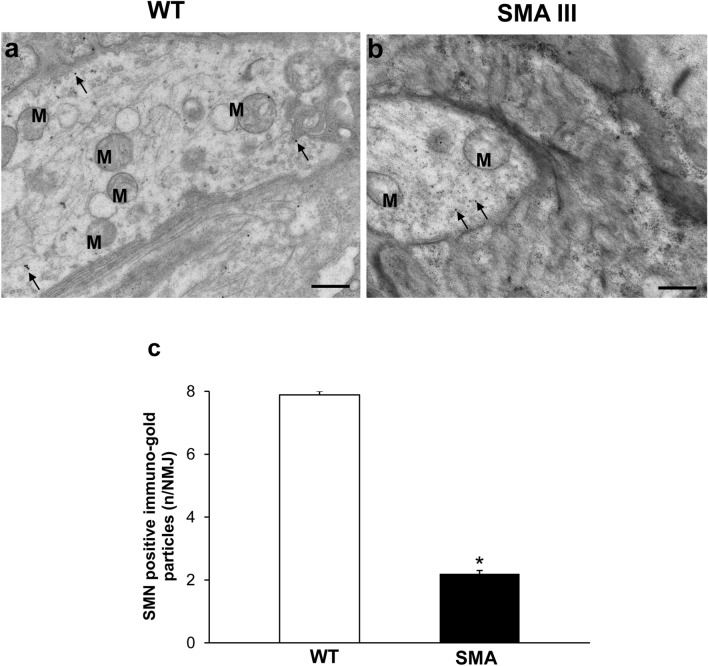
Fig. 7.
Representative localization of SMN in neuromuscular junction (NMJ) in WT and SMA mice. Electron micrograph of NMJ from WT mouse a showing numerous SMN immuno-gold particles (arrows). b Only few SMN immuno-gold particles (arrows) are detected in NMJ from SMA mouse. c The graph reports the number of SMN immuno-gold particles in SMA and WT mice. Values are the mean number ± S.E.M. of 10 NMJ per mouse (100 NMJ per group). Scale bar: a, b = 0.6 µm. *P ≤ 0.05 compared with WT. M mitochondria

