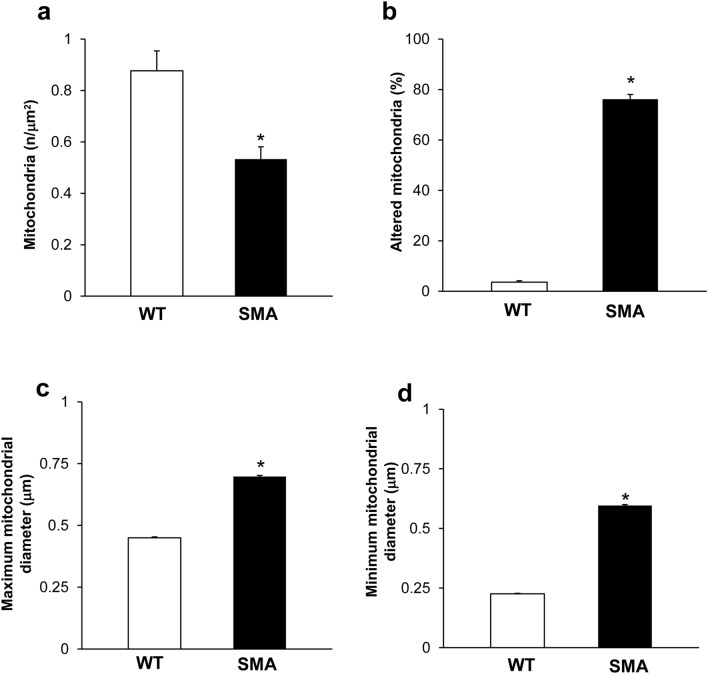
Fig. 8.
Ultrastructural morphometry of mitochondria in neuromuscular junction (NMJ) in WT and SMA mice. Graphs report the number of mitochondria (a), the percentage of altered mitochondria (b), and the maximum and minimum mitochondria diameter (c, d, respectively) in NMJ from WT and SMA mice. Values are the mean number ± S.E.M. from 10 NMJ per mouse (100 NMJ per group, a, c, d); values are the mean percentage ± S.E.M. of 10 NMJ per mouse (100 NMJ per group, b). *P ≤ 0.05 compared with WT

