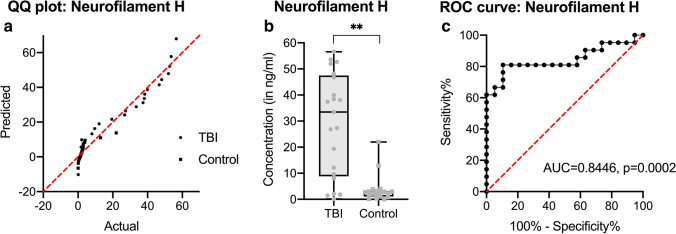
Fig. 3.
Measurement of neurofilament H (NF-H) in cerebrospinal fluid (CSF) samples of traumatic brain injury (TBI) cases and cardiovascular fatalities as controls. After testing for normality (a), the differences of NF-H CSF levels were displayed in black-lined box plots (where the box comprises all measurements between the 25th and 75th percentile and the whiskers range from minimum to maximum) and as grayish dot plots (points for TBI, squares for controls, see (b)). CSF levels were finally tested as a receiver operating characteristics (ROC) curve for threshold determination (c). **p < 0.001

