
Figure 1.
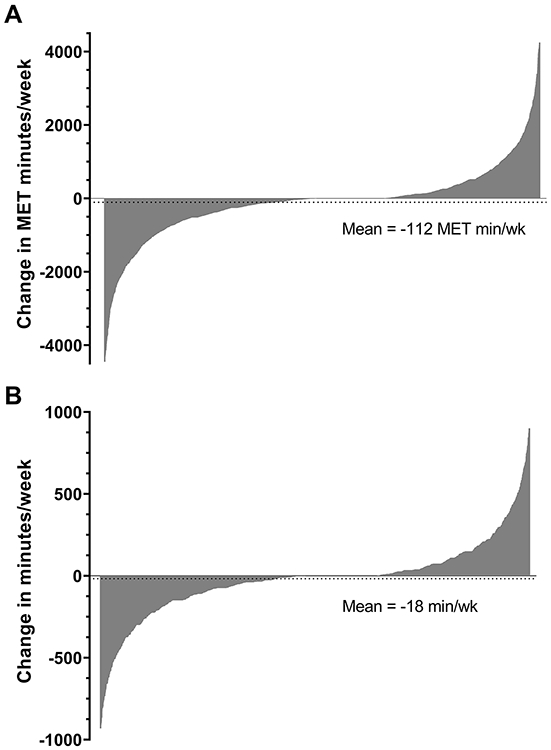
Variability in the change in PA levels from prior to COVID-19. The mean change in PA is represented by the dotted line for A) MET minutes/week = −112 ± 1460 and B) minutes/week = −18 ± 306. While 1,967 participants reporting a decline in PA levels, 2,409 reported no change or an increase in PA levels. Data are presented for those within ± 3 SD from the mean. Abbreviations: MET, metabolic equivalent of task.