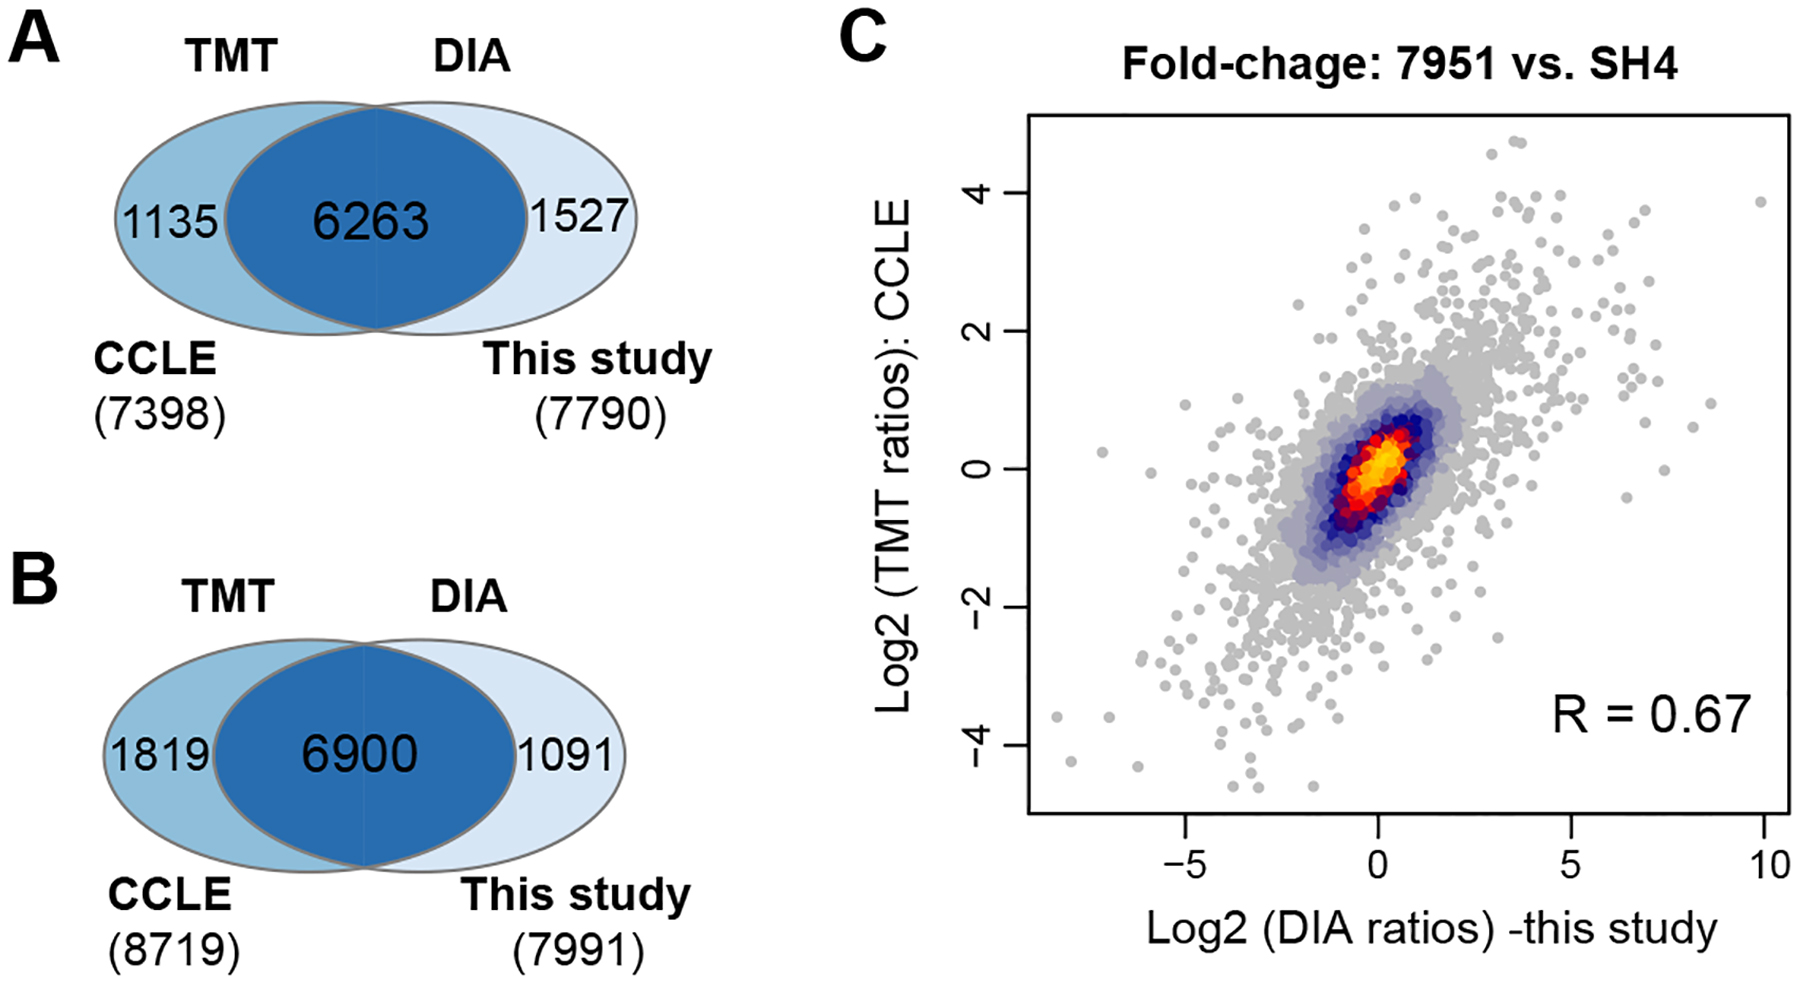
Figure 3 |.

Benchmarking DIA-MS results in this study with the TMT data in Cancer Cell Line Encyclopedia (CCLE). (A) The overlapped proteins without any missing values measured by DIA-MS and TMT. (B) The overlapped proteins of SH4 and 7951 cells measured by DIA-MS and TMT. Note these two cell lines were measured in the same TMT-plex batch. (C) The scatter plot of the protein fold changes between SH4 and 7951 cells measured by DIA-MS and TMT.
