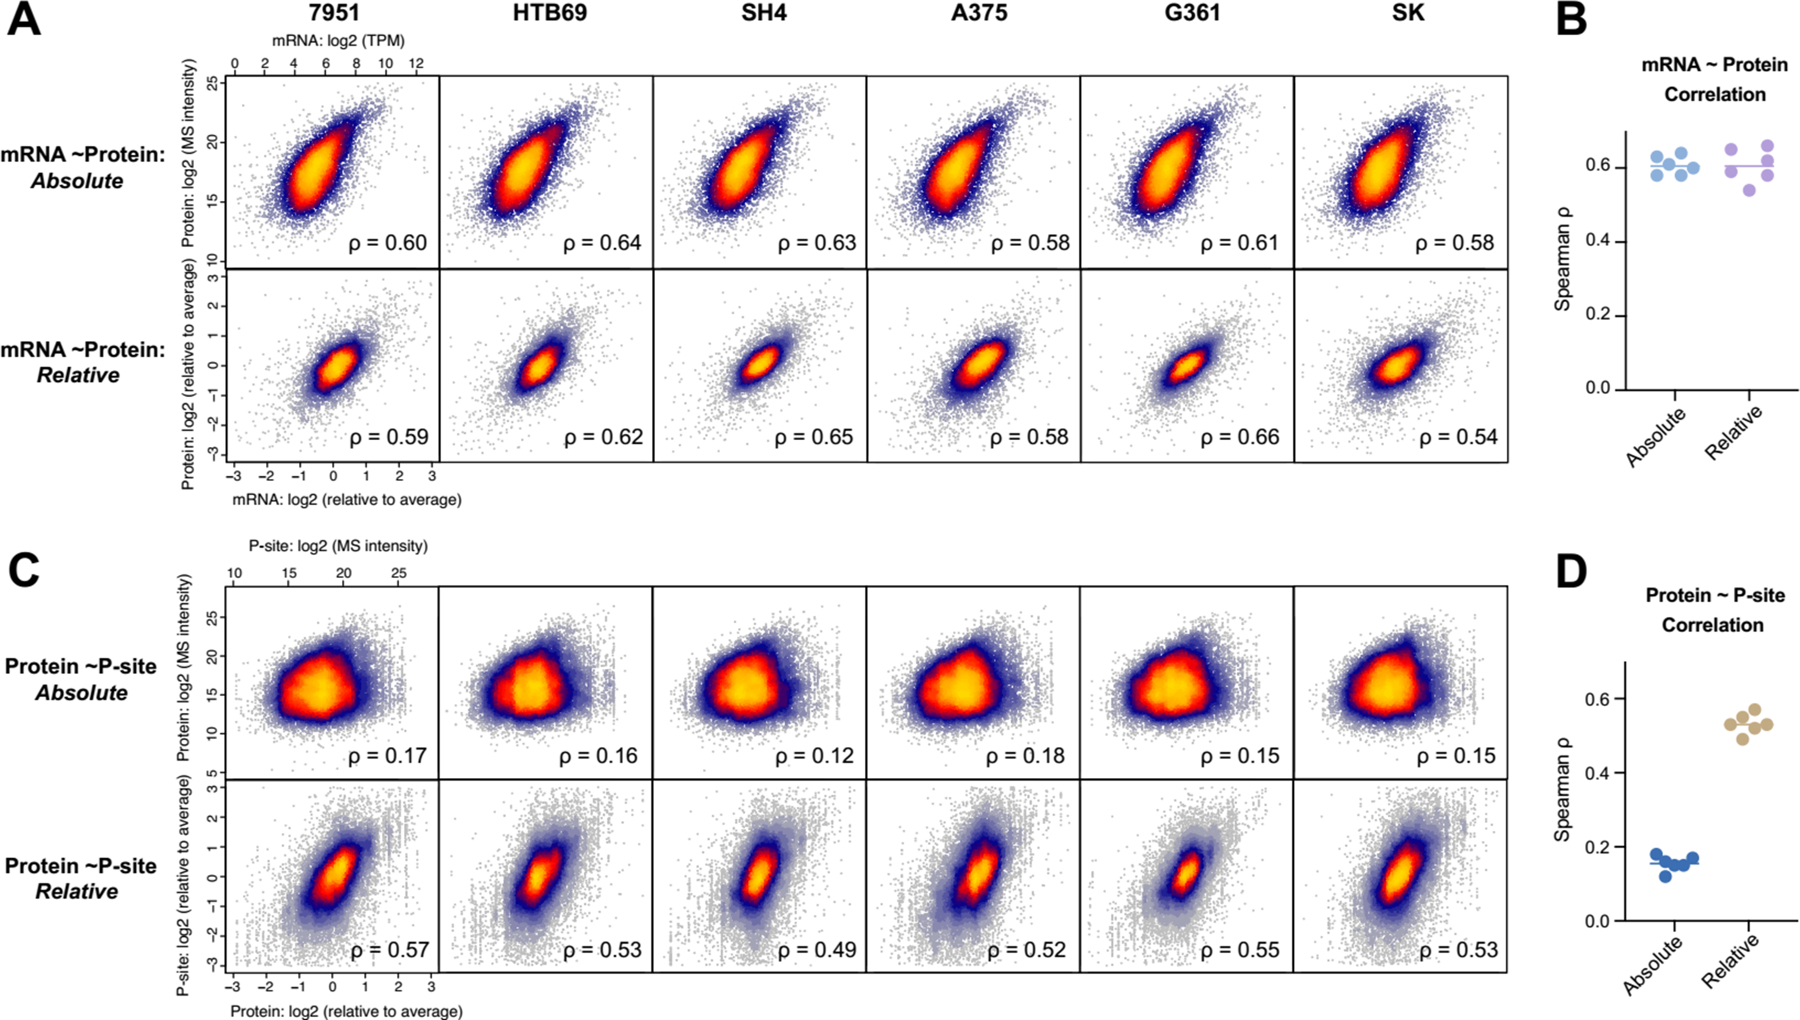
Figure 4 |.

Absolute and relative quantification relationships of mRNA vs. Protein and Protein vs. phosphosite. (A) The scatter plot of mRNA and protein quantities in the absolute (upper panel) and relative (lower panel) scales, separated by six individual six cells. (B) The Spearman correlation between mRNA and protein summarized. (C) The scatter plot of protein and phosphosite quantities in the absolute (upper panel) and relative (lower panel) scales, separated by six individual six cells. (D) The Spearman correlation between protein and phosphosite summarized.
