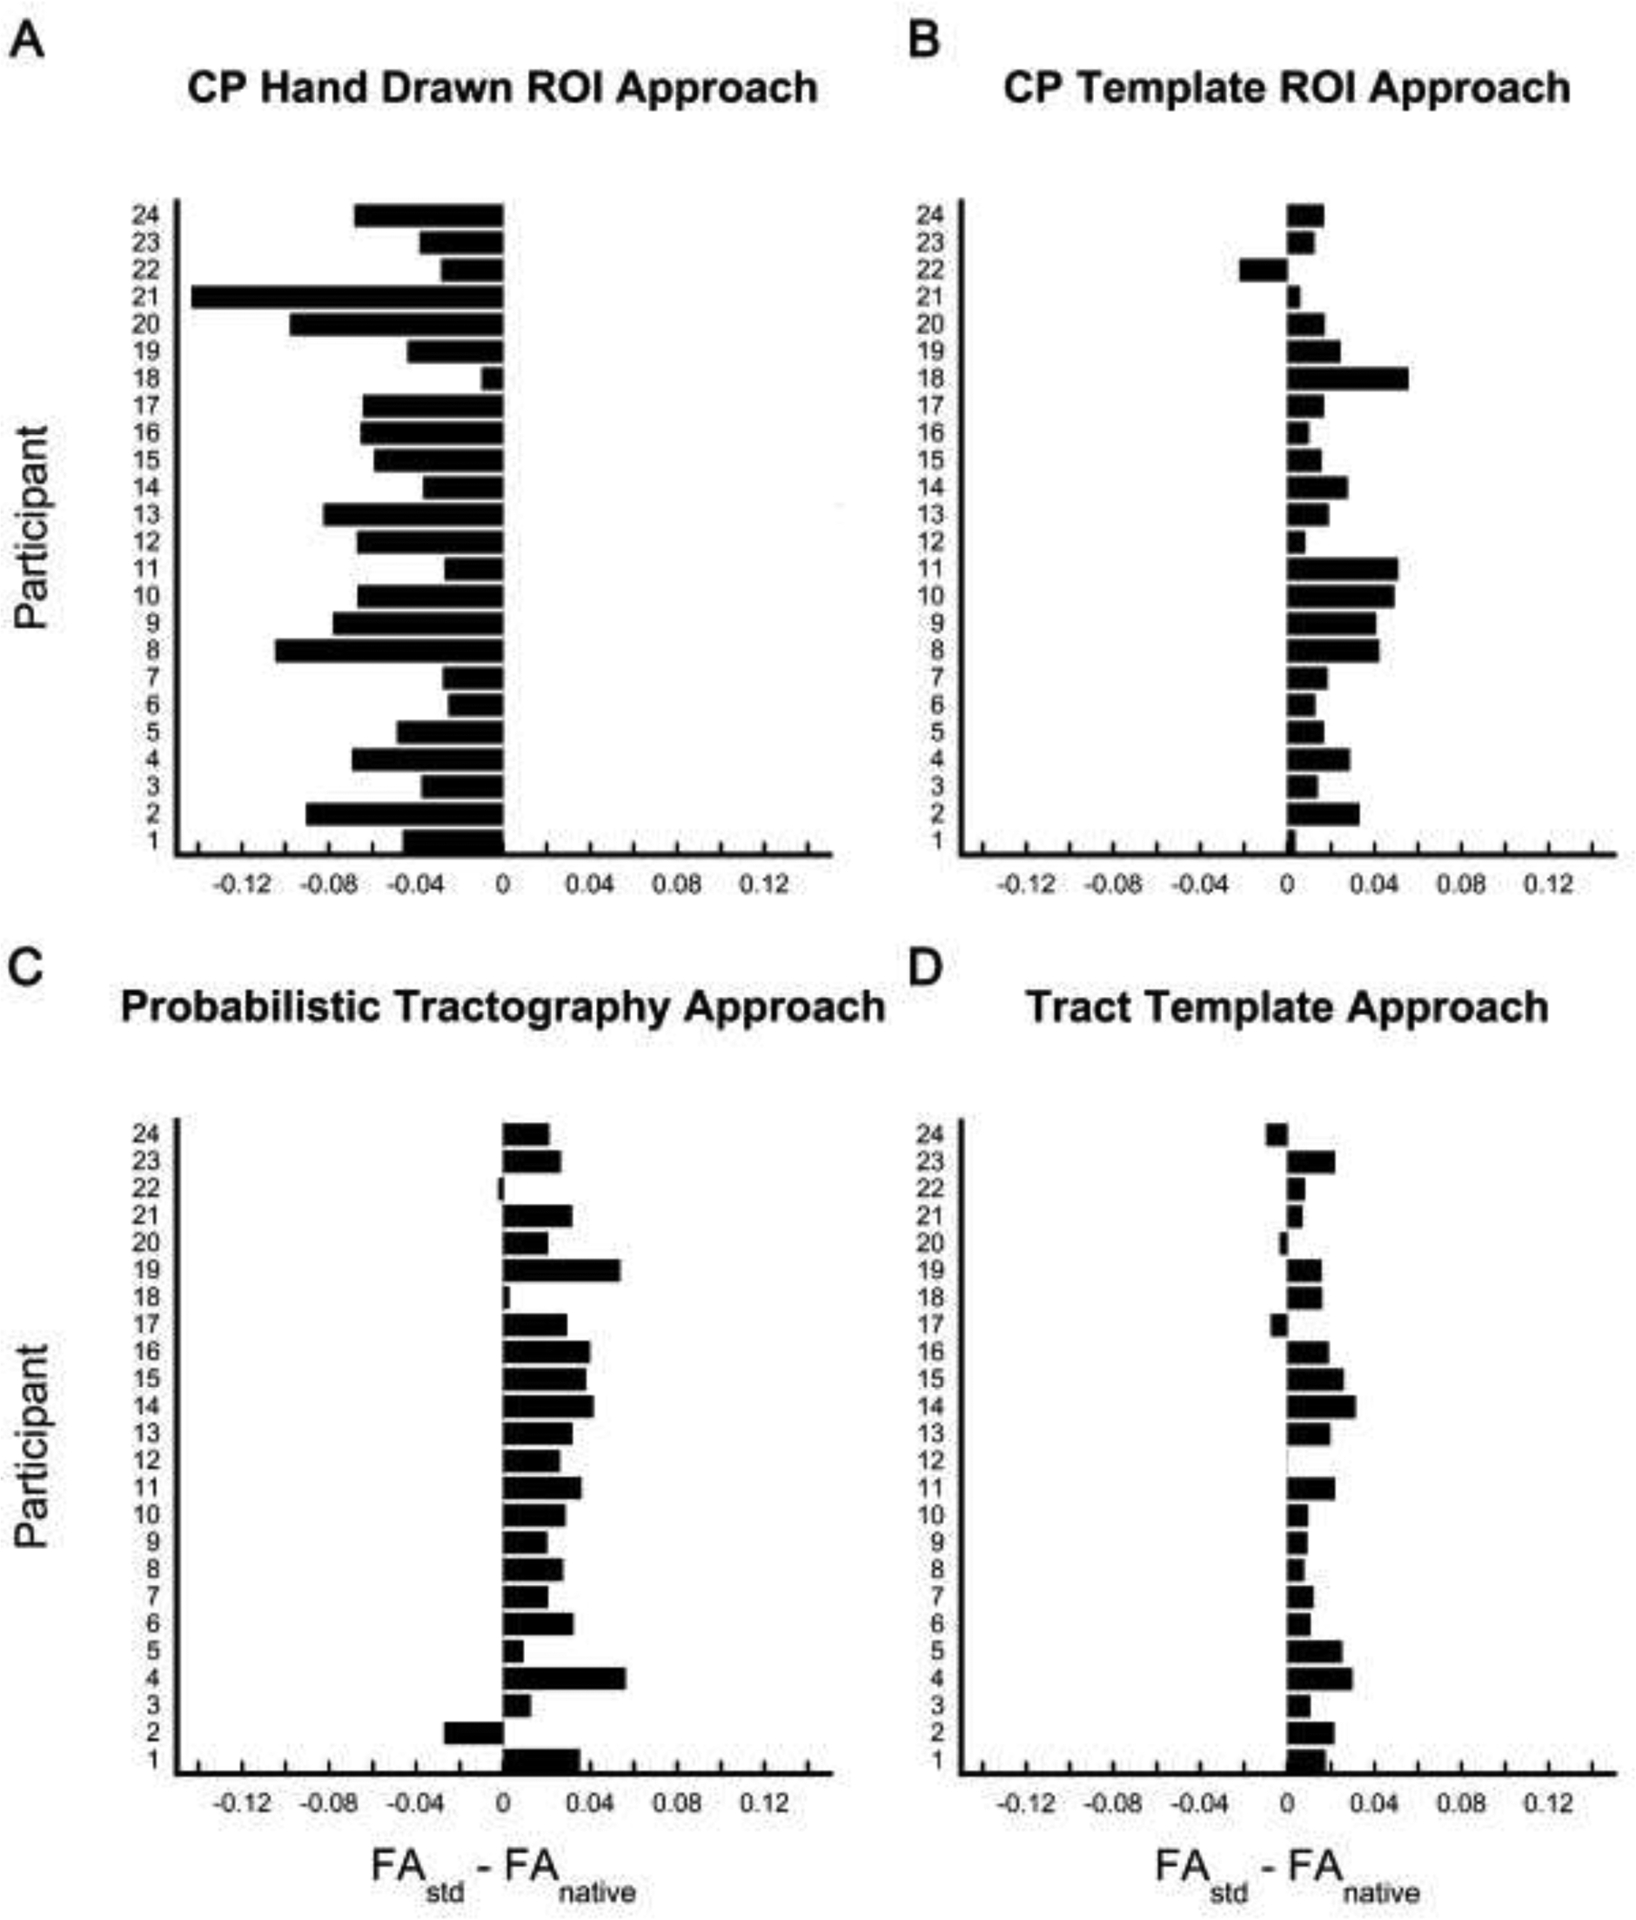
Figure 3:

Bar plots indicating the difference between corticospinal tract (CST) fractional anisotropy extracted from standard space (FAstd) and fractional anisotropy extracted from native space (FAnative) by individual participant. Bars that fall to the right of zero indicate the FAstd was greater than FAnative for that participant, whereas bars that that fall to the left indicate that FAnative was greater than FAstd for that participant. Differences were plotted for each approach: A) CP Hand Drawn ROI approach, B) CP Template ROI approach, C) Probabilistic Tract, and D) Tract Template approach.
