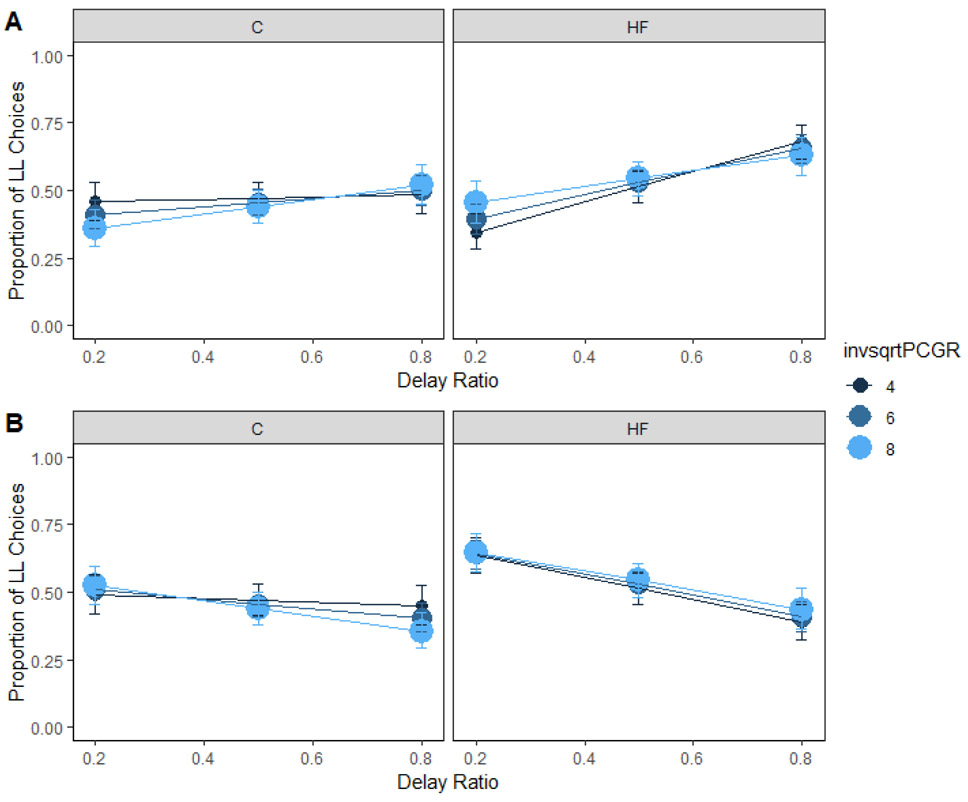
Figure 7. Insulin secretion and choice in humans.
Mean proportion of larger-later (LL) choices for each group as a function of insulin secretion and delay (A) and magnitude (B) ratio in humans. Insulin secretion interacted with diet to predict delay sensitivity. However, post-hoc comparisons were unable to localize the source of the effect. Insulin secretion did not interact with diet to predict magnitude sensitivity. The delay and magnitude ratios were the SS / LL delay or magnitude, respectively. Smaller ratios indicate a larger difference in the delays or magnitudes. HF = high-fat; C = control; invsqrtPCGR = insulin secretion-inverse square root transformed. Error bars (+/− SEM) were computed with respect to the estimated marginal means of the fitted generalized linear mixed-effects model.

