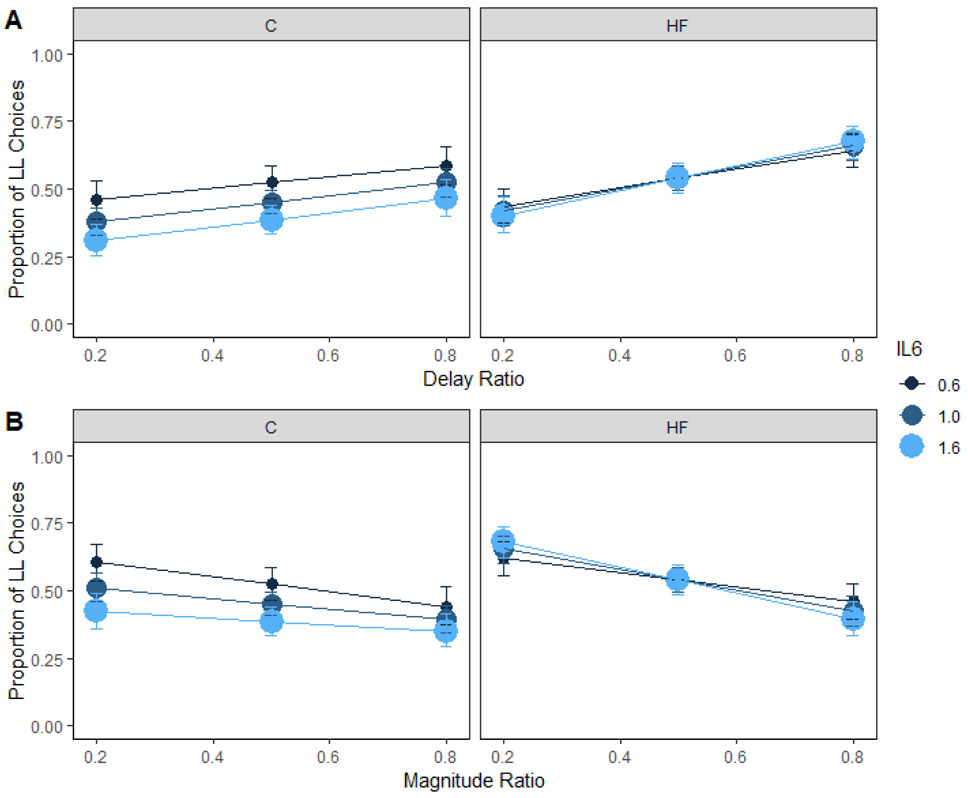
Figure 8. Inflammation and choice in humans.
Mean proportion of larger-later (LL) choices for each group as a function of inflammation and delay (A) and magnitude (B) ratio in humans. Inflammation did not interact with diet to predict delay or magnitude sensitivity. The delay and magnitude ratios were the SS / LL delay or magnitude, respectively. Smaller ratios indicate a larger difference in the delays or magnitudes. HF = high-fat; C = control; IL6 = inflammation. Error bars (+/− SEM) were computed with respect to the estimated marginal means of the fitted generalized linear mixed-effects model.

