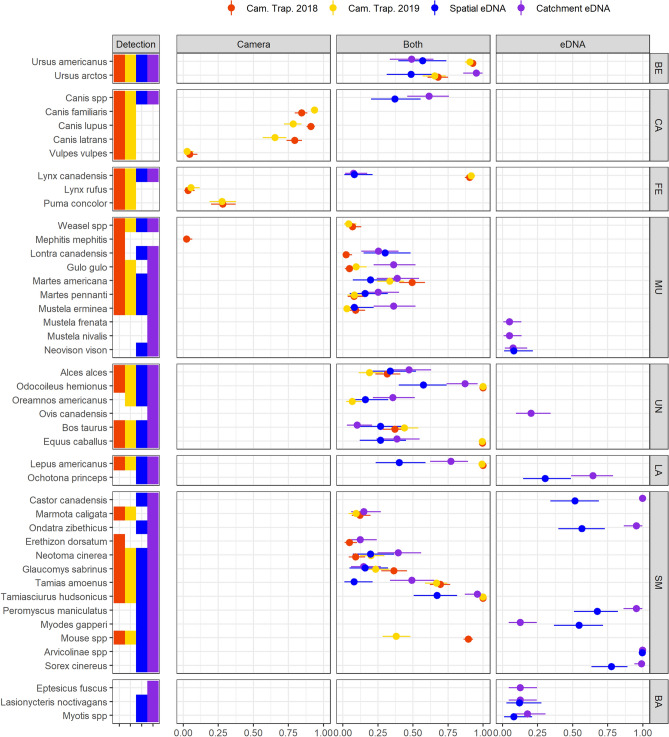
Figure 2.
Overall species detection probabilities. To highlight the differences between methods, we divided the figure in three panels labelled “Camera”, “Both”, and “eDNA”. The left panel shows species detected via camera trapping only, the middle panel shows species detected by both camera trapping (red and yellow) and either eDNA sampling strategy (blue and purple), and the right panel shows species detected only by eDNA. The plain circles indicate the average detection probabilities for every species. The horizontal bars show the limit of the 95% Bayesian Credibility Interval. Scientific names of the taxa are on the left of the panel. Taxa are grouped by higher taxonomic level, which code is displayed on the right of the figure: BE for Bears, CA for canids, FE for felids, UN for ungulates, LA for lagomorphs, SM for small mammals, and BA for bats. The figure does not include 3 additional species (Rangifer tarandus, Mus musculus and Felis spp) each detected in at least one eDNA sample, but which detection might result from contamination (see supplementary Tables 1a,b).

