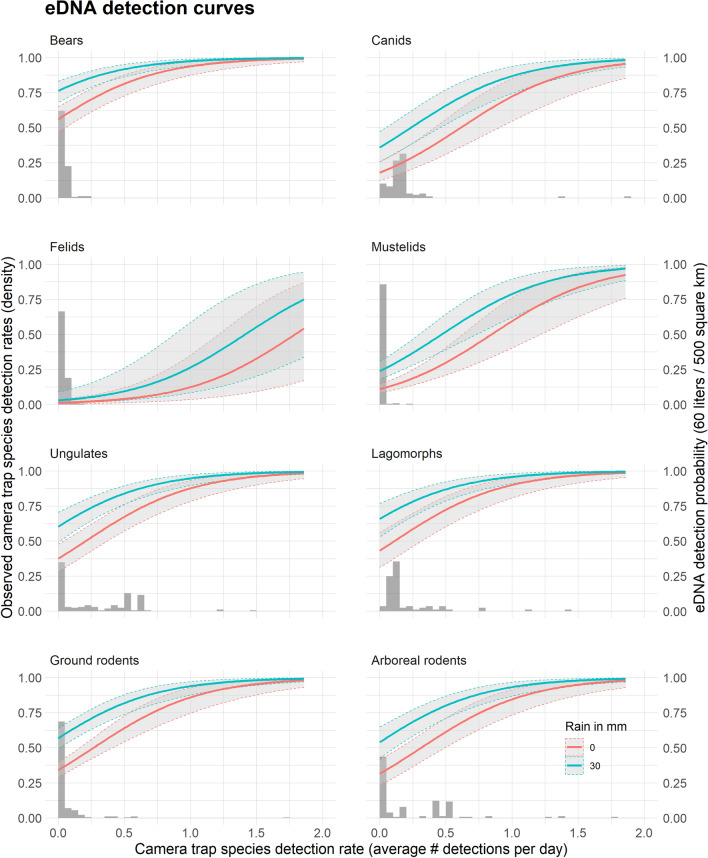
Figure 4.
Taxonomic eDNA detection curves. Relationship between the eDNA detection probability at a site (y-axis, right side), the average camera trap detection rate at the catchment (x-axis), and the rain the day prior to sampling (no rain in red, 30 mm in blue). Curves are calculated for 60 L of water filtered from a stream draining a 500 km2 catchment. The figure shows the mean predicted value (solid lines) and associated standard errors (± SE, grey areas), calculated using the parameter estimates from the model with the lowest AICc (Supplementary Tables 2a,b). The histograms represent the observed density distribution of the average camera trap detection rates associated with eDNA sampling sites (y-axis, left side). For instance, on the “Ground rodents”, the histogram indicates that more than 75% of the eDNA sampling locations were associated with a catchment where on average across all camera trap located in the catchment, less than 0.2 ground rodents were detected every day, or one ground rodent detected every 5 days. Data from 2018 and 2019 are combined.

