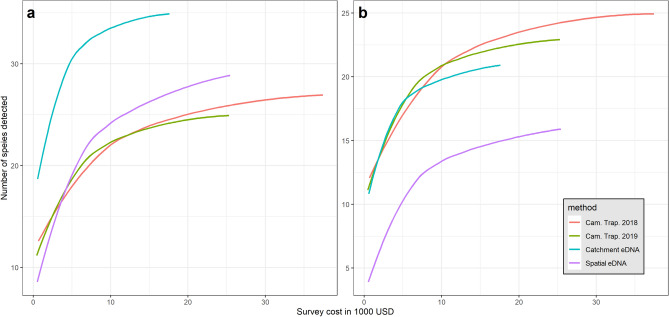
Figure 5.
Comparison of cost-efficiency between survey methods to recover the total mammal diversity at the study scale. The figures show the curves of cumulative total mammals’ diversity (y-axis) per thousand USD (x-axis) invested in the survey. Colours indicate the different survey methods and years as shown in the legend. The panel (a) compares methods’ cost effectiveness when all the taxa detected by either method are included in the analysis, while panel (b) only includes species targeted by camera trapping methods (see “Methods” section). Detailed cost analyses per survey are presented in the method section (see also Table 1 and Supplementary Table 4).

