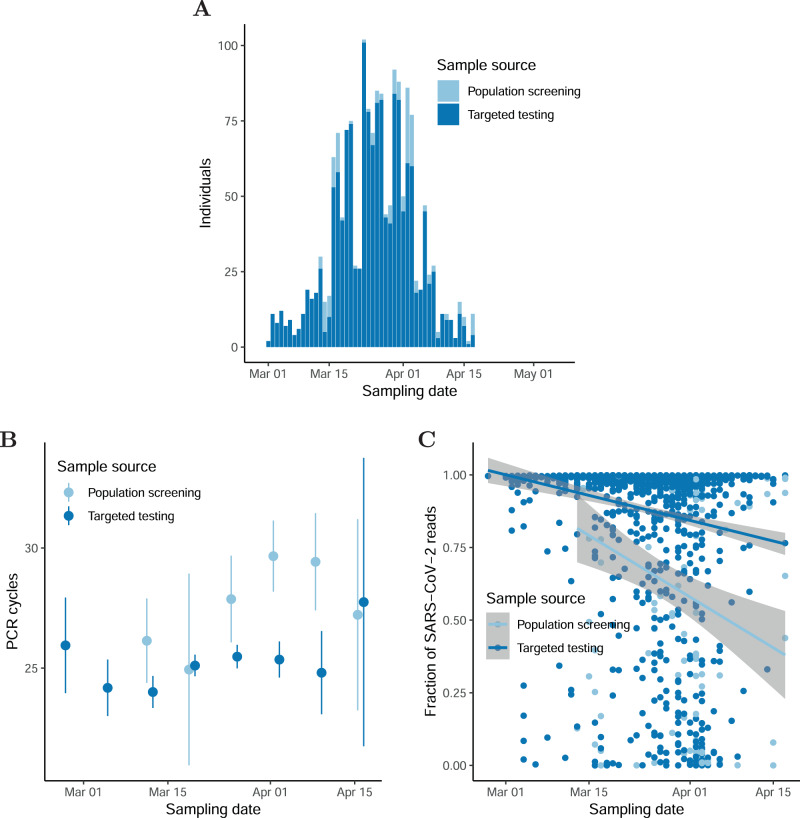
Fig. 2. The Icelandic SARS-CoV-2 epidemic.
A Number of SARS-CoV-2-positive samples by time. B qPCR-CT values as a function of sampling date and sample source. The number of samples in the population screening bins is 45, 8, 32, 53, 11, and 8 ordered by date. The number of samples in the targeted screening bins is 34, 72, 202, 440, 454, 248, 53, and 5 ordered by date. C Fraction of SARS-CoV-2 reads mapping to reference as a function of sampling date and sample source. The center values in error bars and bands are means. The error bars and bands are 95% CIs.

