Figure 2.
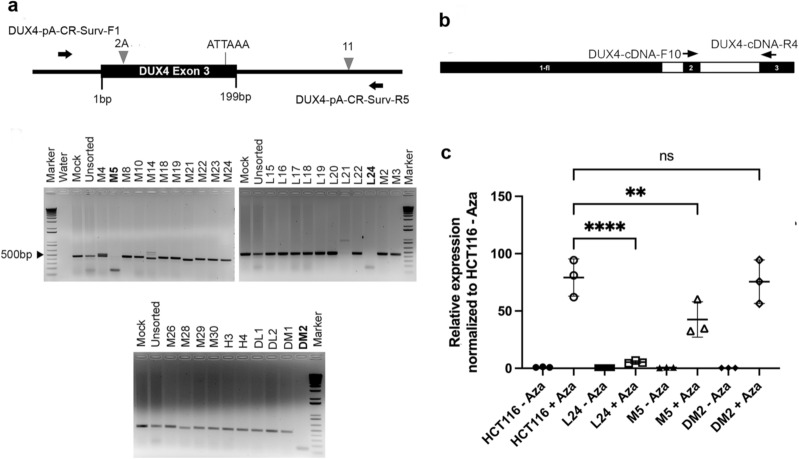
Isolation of DUX4 poly-A targeted single cell clones in HCT116 and transcription of DUX4 and target genes in targeted clones. (a) Top panel shows schematic of the dual-sgRNA PCR based deletion assay with the most suitable combination of sgRNAs upstream (CR-2A) and downstream (CR-11) of the poly-A site. The position of primers used for PCR detection of cut and uncut products are shown as black arrows, along with their names. Bottom panels show representative ethidium bromide stained agarose gels showing deletion assay results in single cell clones of HCT116 targeted with CR-2A and CR-11 sgRNAs. Sample names are included on top along with clone numbers assayed. Clones that were subsequently sequenced and analyzed are highlighted in bold. (b) Labeled arrows show location of forward and reverse primers, relative to the most distal D4Z4 monomer for detection of spliced and polyadenylated DUX4-fl transcripts by qRT-PCR with cDNA samples made with oligo-dT primers. (c) Scatterplots showing results from qRT-PCR analysis for DUX4-fl in HCT116 and three independent DUX4 poly-A knockouts (named on the X-axis) with or without 5-Aza-C treatment. Transcript levels (Y-axis) are expressed as fold change normalized to expression level in untreated parental HCT116 cells, relative to GAPDH expression. All values are obtained by averaging results from triplicates for each sample. Error bars represent standard deviation (n = 3). Statistical significance is indicated (**p ≤ 0.01, ****p ≤ 0.0001, ns no significant difference; p > 0.05). Schematic diagrams were generated using Microsoft PowerPoint 16.48 (https://www.microsoft.com) and Adobe Photoshop 21.0.1 (https://www.adobe.com).

