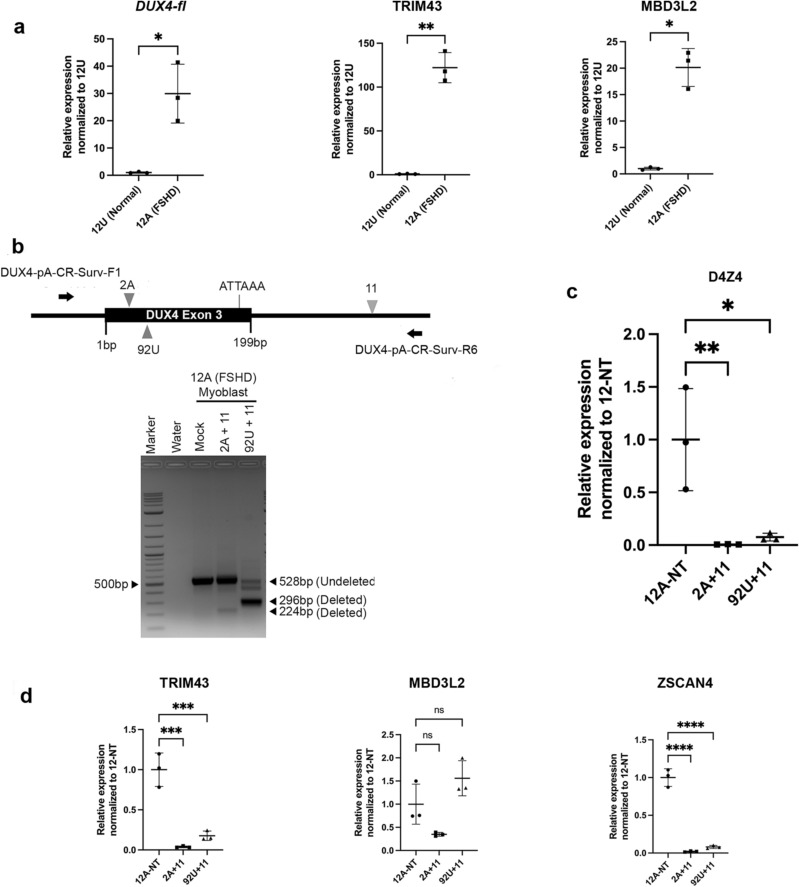
Figure 3.
CRISPR-Cas9 mediated targeting of pathogenic poly-A and downregulation of DUX4 and target genes in patient myoblasts. (a) qRT-PCR analysis for DUX4-fl (left) and target genes TRIM43 and MBD3L2 in unaffected and patient hTERT immortalized myoblasts. Transcript levels are expressed as fold change normalized to expression level in unaffected (12U) myoblasts, relative to GAPDH expression. All values are obtained by averaging results from triplicates for each sample. Statistical significance is indicated (*p ≤ 0.05; **p ≤ 0.01). (b) Top panel shows schematic of for the dual-sgRNA PCR based deletion assay with two suitable combination of sgRNAs upstream (CR-2A or CR-92U) and downstream (CR-11) of the poly-A site, indicated by triangles. CR-92U binds to the antisense strand, as indicated by inverted triangle. The position of primers used for PCR detection of cut and uncut products are shown as black arrows, along with their names. Bottom panel shows results of a trial deletion assay using abovementioned sgRNAs cloned in suitable lentiviral vectors, transduced in patient myoblast cells. Sample names are indicated on top. The expected size for undeleted and deleted PCR products is indicated on the right-hand side by black triangles. (c) qRT-PCR analysis for D4Z4 in patient (12A) control (NT) myoblasts, along with cells treated with different sgRNA combinations (named on the X-axis) targeting DUX4 poly-A. Transcript levels (Y-axis) are expressed as fold change normalized to expression level in control (NT) myoblasts, relative to ACTB expression. All values are obtained by averaging results from triplicates for each sample. Error bars represent standard deviation (n = 3). Statistical significance is indicated (*p ≤ 0.05; **p ≤ 0.01). (d) qRT-PCR analysis for DUX4 target gene expression in patient myoblast controls and cells treated with different sgRNA combinations (named on the X-axis) targeting DUX4 poly-A. Transcript levels (Y-axis) for TRIM43, MBD3L2 and ZSCAN4 are expressed as fold change normalized to expression level in control (NT) patient myoblasts, relative to ACTB expression. All values are obtained by averaging results from triplicates for each sample. Statistical significance is indicated (***p ≤ 0.001; ****p ≤ 0.0001; ns no significant difference; p > 0.05). Schematic diagrams were generated using Microsoft PowerPoint 16.48 (https://www.microsoft.com) and Adobe Photoshop 21.0.1 (https://www.adobe.com).

