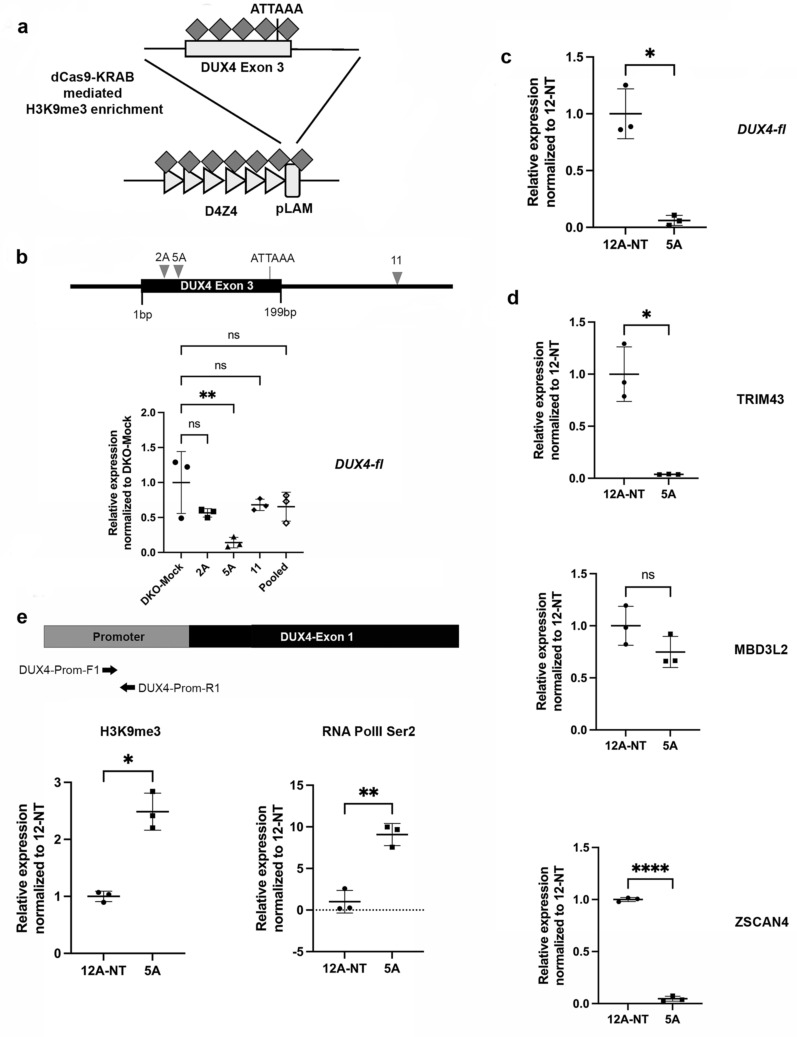
Figure 4.
Downregulation of DUX4 and target genes by dCas9-KRAB mediated enrichment of H3K9me3 in patient myoblasts. (a) Schematic showing targeting strategy to enrich H3K9me3 and repress DUX4 using a dCas9-KRAB effector recruited by suitable sgRNAs designed at DUX4 exon 3. (b) Top panel shows schematic for binding sites of three previously used sgRNAs in DUX4 exon 3. Bottom panel shows qRT-PCR analysis for DUX4-fl in mock (dCas9-KRAB only) and sgRNA-transfected DKO cells. Sample names are indicated on the X-axis. sgRNAs were tested individually as well as a pool. Transcript levels (Y-axis) are expressed as fold change normalized to expression level in mock DKO cells, relative to GAPDH expression. All values are obtained by averaging results from triplicates for each sample. Statistical significance is indicated (**p ≤ 0.01; ns no significant difference; p > 0.05) (c) qRT-PCR analysis for DUX4-fl in patient myoblast controls, along with cells treated with the sgRNA (CR-5A) Sample names are indicated on the X-axis. Transcript levels (Y-axis) are expressed as fold change normalized to control (NT) patient myoblasts, relative to ACTB expression. All values are obtained by averaging results from triplicates for each sample. Error bars represent standard deviation (n = 3). Statistical significance is indicated (*p ≤ 0.05). (d) qRT-PCR analysis for DUX4 target genes TRIM43, MBD3L2 and ZSCAN4 control and sgRNA (CR-5A) targeted patient myoblasts. Transcript levels are expressed as fold-change normalized to expression level in control (NT) patient myoblasts, relative to ACTB expression. All values are obtained by averaging results from triplicates for each sample. Error bars represent standard deviation (n = 3). Statistical significance is indicated (*p ≤ 0.05, ****p ≤ 0.0001, ns no significant difference; p > 0.05). (e) Results of qPCR for H3K9me3 and RNAPolII-S2 ChIP in control and sgRNA targeted patient myoblasts. Labeled arrows show location of primers in the DUX4 promoter region (grey), relative to the DUX4 ORF (black) within each D4Z4 monomer. Sample names are indicated on the X-axis while enrichment values on the Y-axis are expressed as percentage of corresponding input samples, after normalization with respect to corresponding RS samples. All values are obtained by averaging results from triplicates for each sample. Error bars represent standard deviation (n = 3). Statistical significance is indicated (*p ≤ 0.05, **p ≤ 0.01). Schematic diagrams were generated using Microsoft PowerPoint 16.48 (https://www.microsoft.com) and Adobe Photoshop 21.0.1 (https://www.adobe.com).

