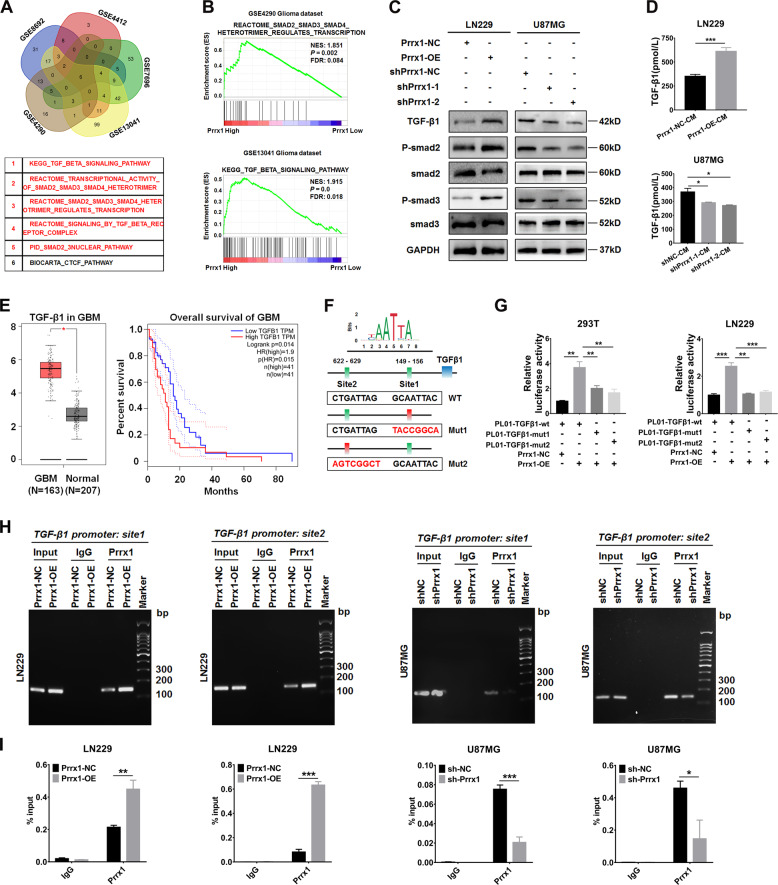
Fig. 4. Prrx1 activates TGF-β/smad pathway by transactivating TGF-β1.
A GSEA was conducted to compare high Prrx1 and low Prrx1 expression groups in five published gene expression profiles of glioma specimens (GSE4290, GSE4412, GSE7696, GSE8692, and GSE13041). The five-way Venn diagram of enrichment results in each dataset is shown and gene sets common to all datasets are extracted. B Representative enrichment plots of TGF-β/smad pathway are shown. C Western blots analysis of the TGF-β/smad pathway in the indicated cells. D The concentration of TGF-β1 was detected in the culture medium of Prrx1 overexpressed LN229 cells and Prrx1 silencing U87MG cells by ELISA assay (mean ± SD, n = 3). E Left panel represents transcriptional expression of TGF-β1 in GBM relative to normal brain tissues (GEPIA database, http://gepia.cancer-pku.cn/). Right panel represents Kaplan–Meier survival curve comparing the high and low expression of TGF-β1 (determined by the quantile value) for the TCGA GBM patient cohort (GEPIA database). F Potential binding sites of Prrx1 in TGF-β1 promotor were predicted by JASPAR2020 (http://jaspar.genereg.net). G TGF-β1 promotor-luciferase wild type or mutated reporters were co-transfected with pwslv-07-Prrx1, and then luciferase reporter assays were performed. H Control, Prrx1-knockdown and Prrx1-overexpression cells were used for ChIP assay. Amplification of Prrx1-binding sites 1 and 2 after ChIP analysis was indicated in the agarose gel. The gel figures were accompanied by the locations of molecular weight markers. I ChIP-qPCR analysis of Prrx1 enrichment in the TGF-β1 gene promoters in control, Prrx1-knockdown and Prrx1-overexpression cells. *P < 0.05, **P < 0.01, ***P < 0.001.

