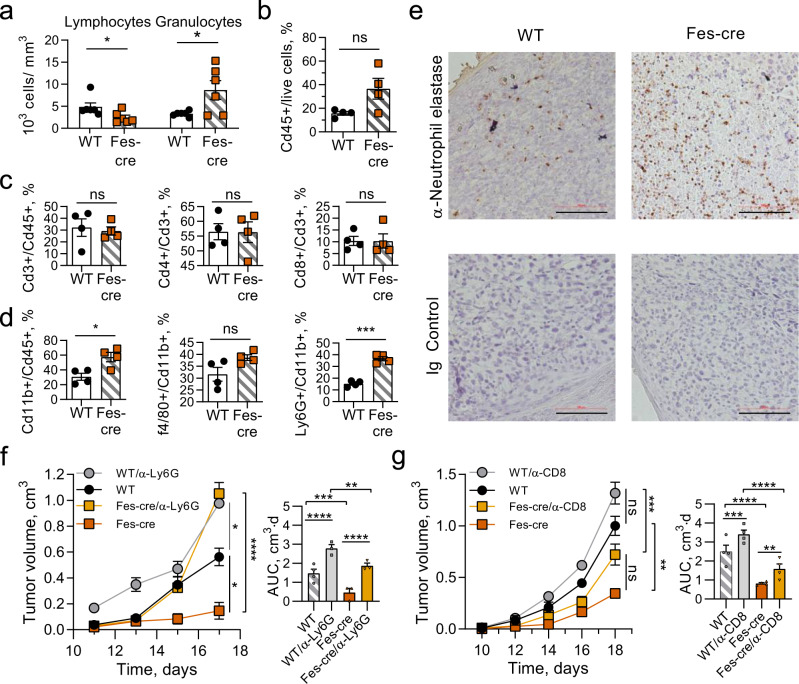
Fig. 2. Wip1-deficient neutrophils infiltrate tumors extensively and their depletion accelerates tumorigenesis in Wip1-deficient mice.
a Peripheral blood composition in Ppm1dfl/fl (WT) and Ppm1dFes-Cre (Fes-Cre) mice bearing B16. F10 melanoma tumors (day 16, n = 6 each genotype). Panels b–d: Infiltration of immune cells into B16 tumors in Ppm1dfl/fl (WT) and Ppm1dFes-Cre (Fes-Cre) mice (n = 4 each genotype). b Cd45+ leukocytes. c Cd3+ T cells, Cd4+ helper T cells, and Cd8+ cytotoxic T cells. d Cd11b+ myeloid cells, f4/80+ macrophages, and Ly6G+ neutrophils. e Neutrophil infiltration of B16 tumors in Ppm1dfl/fl and Ppm1dFes-Cre mice visualized by IHC. Neutrophil elastase-positive cells (α-Elane, brown) with counterstain (blue) (one representative experiment out of 4 is shown). f, g Tumor volume (left) and AUC (right) for growth of B16 F10 tumors in WT and Ppm1dFes-Cre mice undergoing immune cell depletion by serial injection of neutralizing anti-Ly6G+ antibodies (panel f, n = 4 for WT and n = 3 for the remaining groups) or neutralizing anti-CD8+ antibodies (panel g, n = 4 for each group). Data are depicted as means ± SEM. Student’s t test (two-tailed) (a–d) or ordinary one-way ANOVA with Sidak’s multiple-comparison test (f, g): *p < 0.05; **p < 0.01; ***p < 0.001; ****p < 0.0001, ns—nonsignificant (one representative experiment out of 2 is shown for panels f and g). Source data are provided as a Source Excel Data file.

