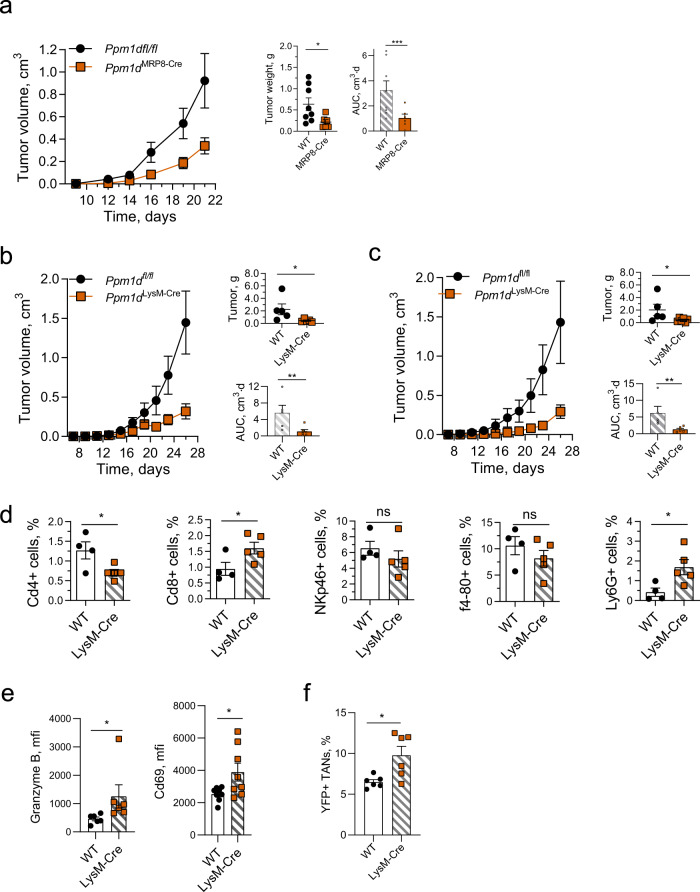
Fig. 4. Wip1 deficiency in myeloid immune cells suppresses the growth of solid tumors.
a Tumor volume (left), endpoint tumor weights (center), and AUC (right) for growth of B16 F10 tumors in Ppm1dfl/fl (n = 8) and Ppm1dMRP8-CRE (n = 6) mice. b Tumor volume (left), endpoint tumor weights (upper right), and tumor growth area under the curve (AUC) (lower right) for growth of B16 F10 melanoma tumors in Ppm1dfl/fl (n = 5) and Ppm1dLysM-Cre (n = 6) mice. c Tumor volume (left), endpoint tumor weights (upper right), and AUC (lower right) for growth of LLC1 lung carcinoma tumors in Ppm1dfl/fl (n = 5) and Ppm1dLysM-Cre mice (n = 6). d Infiltration by immune cell subsets into LLC1 tumors engrafted in Ppm1dfl/fl (WT, n = 4) and Ppm1dLysM-Cre (LysM-Cre, n = 5) mice. e Expression of activation markers in CD8 + T cells infiltrated in B16 F10 tumors in Ppm1dfl/fl (WT) and Ppm1dLysM-Cre (LysM-Cre) mice on day 16 (Granzyme B—n = 6, Cd69—n = 8 each genotype). f Infiltration of B16 F10 tumors by YFP + WTLysM-cre or YFP + Ppm1dLysM-cre neutrophils after their adoptive transfer in wild-type tumor-bearing mice (n = 6 for each genotype). Data are depicted as means ± SEM. Student’s t test (two-tailed) (panels d, e and panels a, b, c: tumor weights) or Mann–Whitney test (two-tailed) (panels a, b, e: AUC, and panel f): *p < 0.05; **p < 0.01; ***p < 0.001 (one representative experiment out of 3 is shown for panel a, b and one out of 2 is shown for panel f). Source data are provided as a Source Excel Data file.

