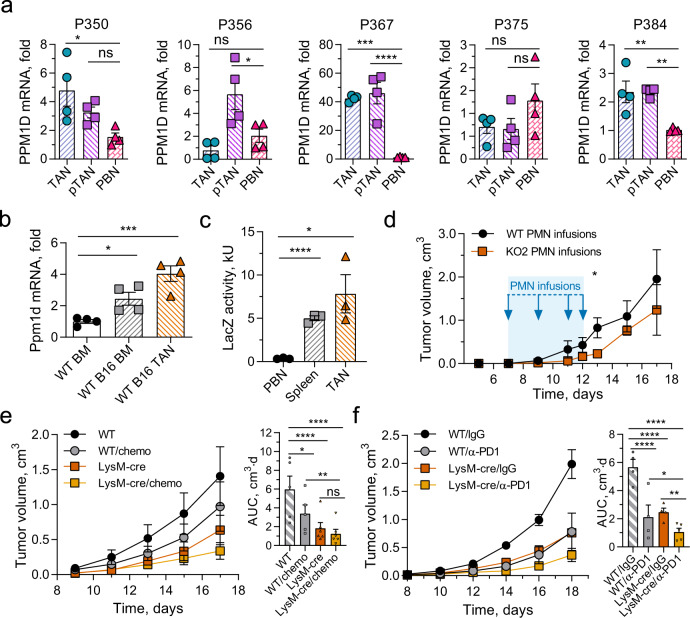
Fig. 6. Tumor-associated neutrophils express high levels of Wip1 and inactivation of Wip1 in myeloid cells enhances antitumor responses.
a Relative PPM1D mRNA levels in neutrophils isolated from surgically resected tumors (TAN), peri-tumor tissues (pTAN), or peripheral blood (PBN) from five patients with Stage I–II lung cancer (n = 5 different patients examined over 4 individual experiments). b Relative Ppm1d mRNA levels in neutrophils isolated from bone marrow of naive (WT BM) or B16 tumor-bearing (WT BM B16) Ppm1d+/+ mice and from B16 tumors engrafted in Ppm1d+/+ mice (WT TAN B16) (n = 4 each condition). c Flow cytometry analysis of LacZ activity in neutrophils isolated from peripheral blood (PBN), spleen (Spleen), or B16 tumors (TAN) of tumor-bearing Ppm1d promoter LacZ reporter mice (Ppm1d+/KO2) (n = 3 each condition). d Growth of B16 melanoma tumors in WT mice treated on days 7, 9, 11, and 12 (blue arrows) with injection of neutralizing anti-Ly6G+ antibodies to deplete host neutrophils and infusion of Ppm1d+/+ (WT PMN) or Ppm1dKO2/KO2 (KO PMN) donor neutrophils (n = 4 each genotype). e Tumor volume (left) and AUC (right) for growth of B16 F10 tumors in Ppm1d+/+ (WT, n = 5 each condition) and Ppm1dLysM-Cre (LysM-Cre, n = 6 each condition) mice without and with oxaliplatin+5FU combination chemotherapy (chemo). f Tumor volume (left) and AUC (right) for growth of B16 F10 tumors in Ppm1d+/+ (WT, n = 4 each condition) and Ppm1dLysM-Cre (LysM-Cre, n = 4, untreated, n = 5 α-PD1) mice without and with anti-PD1 antibody treatment (α-PD1). Data are depicted as means ± SEM. One-way ANOVA with Dunnett’s (a–c) or Sidak’s (e, f) multiple- comparison test or Student’s t test (two-tailed) (d, day 13): *p < 0.05; **p < 0.01; ***p < 0.001; ****p < 0.0001 (one representative experiment out of two is shown for panel d and out of three is shown for panel e, f). Source data are provided as a Source Excel Data file.

