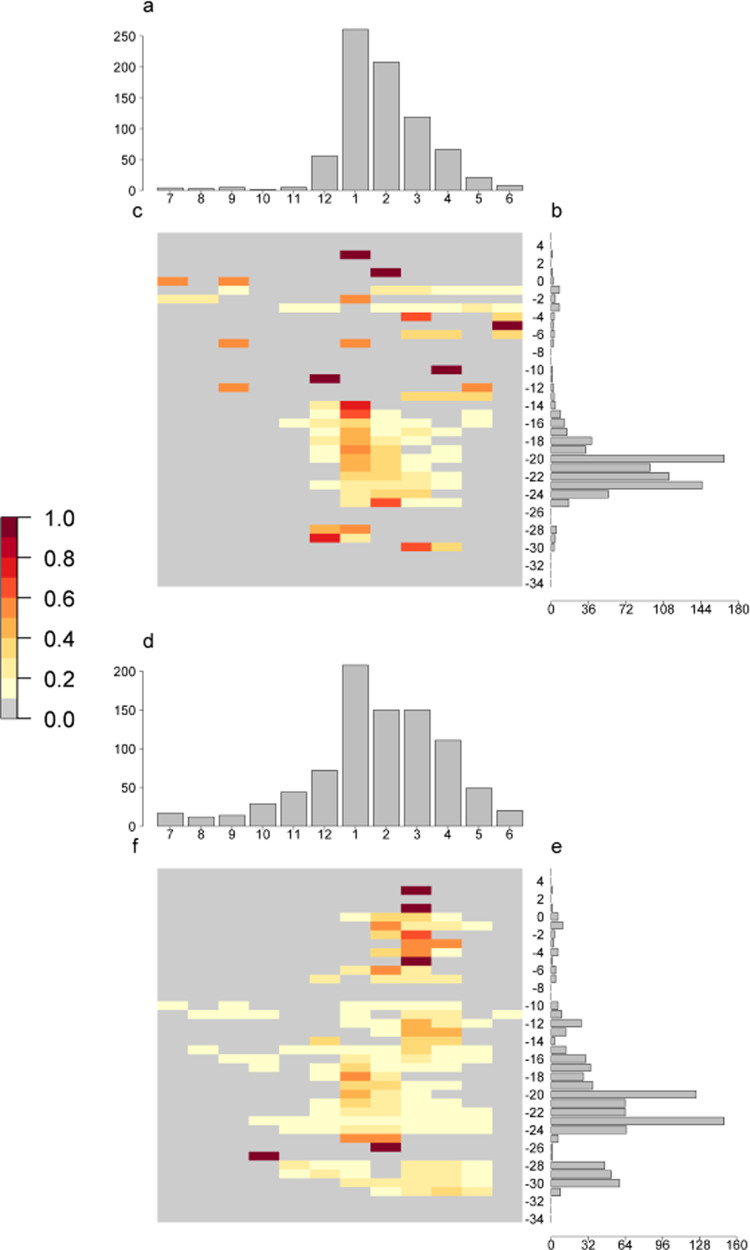
Fig. 1. The proportion of human and NHP reports occurring each month by 1° latitude across Brazil.
A The number of human YF reports by both across Brazil, B the proportion of human reports occurring at each latitude, C the number of human YF reports by 1° latitude. D The number of NHP YF reports by both across Brazil, E the proportion of NHP reports occurring at each latitude, F the number of NHP YF reports by 1° latitude. Shade of cell refers to the proportion of reports occurring at the latitude.

