
Fig. 2. Comparison of training and validating AUC values for human, NHP and municipalities with both.
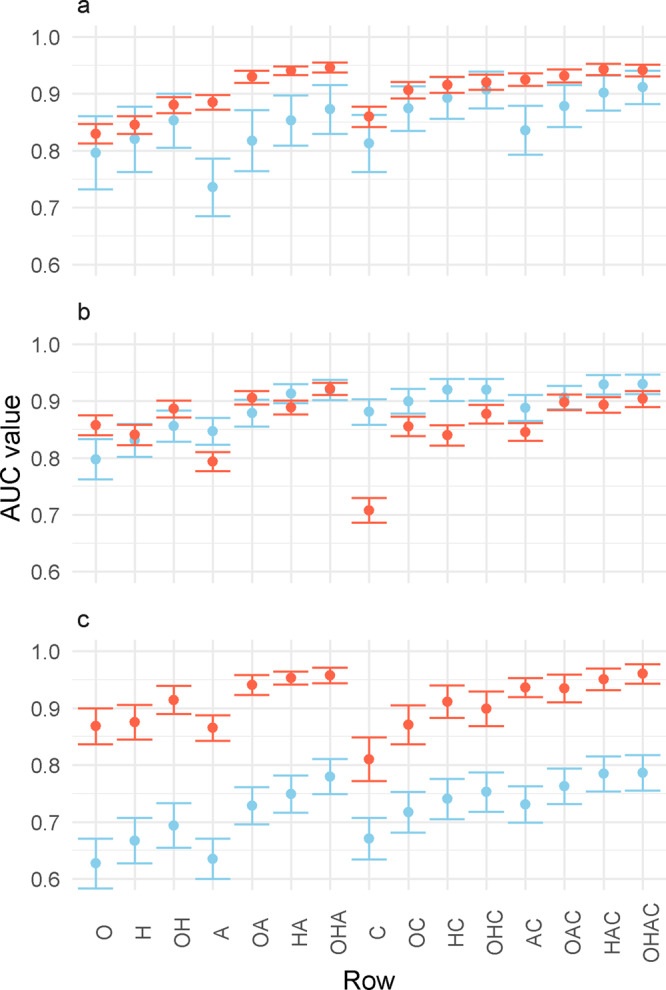
AUC values for the classification of a municipality as having (A), human YF report (B), NHP YF report and (C) human and NHP YF report. The x-axis numbers refer to the models found in Table 1. Red refers to the training AUC value and blue the validation AUC value. Error bars represent the 95% confidence intervals of the prediction, calculated from the 100 out-of-sample validation AUC values for each model formulation. N = 100 out-of-sample calculations of the AUC for 15 independent models.