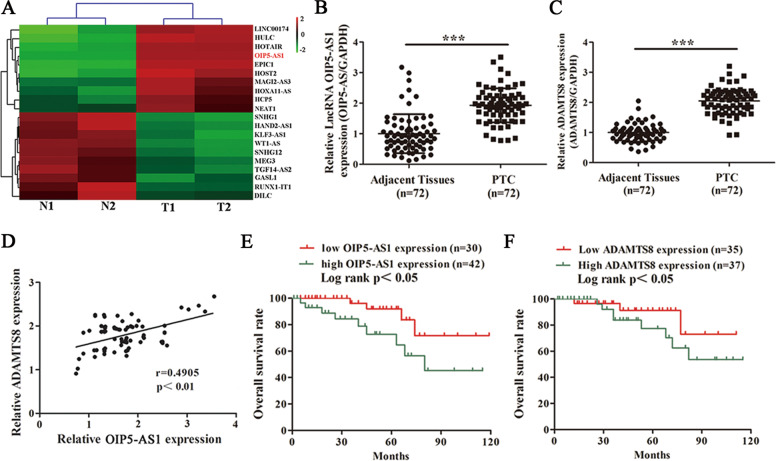
Fig. 1. OIP5-AS1 and ADAMTS8 are upregulated in PTC.
A Heatmap illustrating the 20 differentially regulated lncRNAs between two pairs of tumor tissues and corresponding adjacent tissuesfrom PTC patients (fold change >2, p < 0.05). The mark in red denotes lncRNA OIP5-AS1. B, C Representative OIP5-AS1 and ADAMTS8 expression in tumor sections of 72 patients with PTC were detected by qRT-PCR. D Pearson correction of OIP5-AS1 and ADAMTS8 were analysed (n = 72). E, F Survival rate of PTC patients was analyzed by Kaplan–Meier method. Log-rank tests were used to determine statistical significance. ***p < 0.001.

