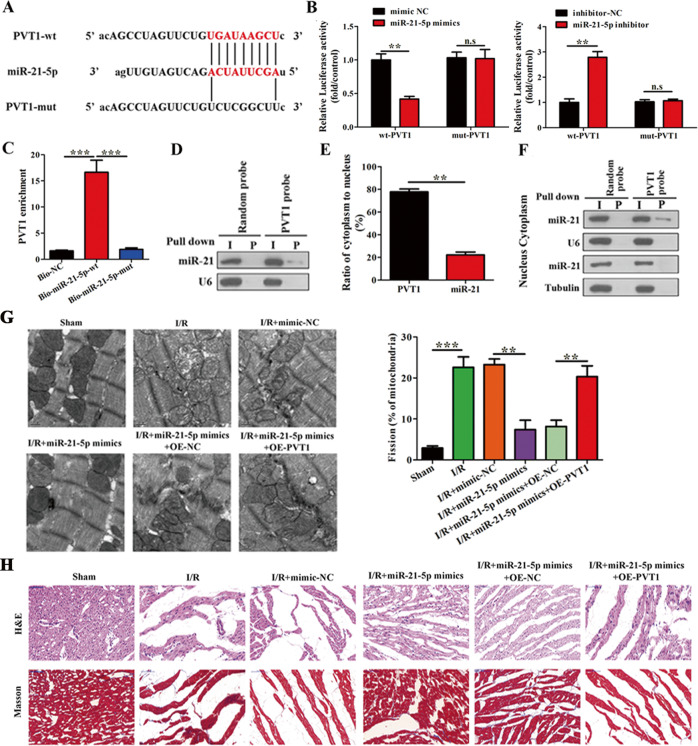
Fig. 5. PVT1 directly binds to miR-21-5p and suppresses its activity.
A Predicted binding sites of PVT1 and miR-21-5p using Starbase 3.0. B The luciferase reporter assay was performed in cardiomyocytes co-transfected with mimic-NC, miR-21-5p mimic, or inhibitor-NC, miR-21-5p inhibitor, and PVT1-wt or PVT1-mut (n = 3). C Cardiomyocytes were transfected with biotinylated WT miR-21-5p (Bio-miR-21-5p-wt) or biotinylated mutant miR-21-5p (Bio-miR-21-5p-mut). A biotinylated miRNA that was not complementary to PVT1 was used as the normal control (Bio-NC). 48 h post transfection, the cells were harvested for a biotin-based pull-down assay and PVT1 expression levels were analyzed by qRT-PCR (n = 3). D Representative northern blot evaluating expression of miR-21-5p in random or in PVT1 DNA probe pull-down fractions (n = 3). E, F Detection of nuclear or cytoplasmic fractions of PVT1 and miR-21-5p in cardiomyocytes was determined by northern blotting. Tubulin and proliferating cell nuclear antigen (PCNA) were used as controls for cytoplasmic and nuclear fractions, respectively (n = 3). G Representative TEM images of heart tissues under different conditions of miR-21-5p mimic treatment and PVT1 overexpression (OE-PVT1). Quantification of fragmented mitochondria is shown in the right panel (Scale bar = 0.5 μm) (n = 6). H Representative images of H&E and Masson’s trichrome staining of LV sections (Scale bar = 50 μm) (n = 3). **P < 0.01; ***P < 0.001.

