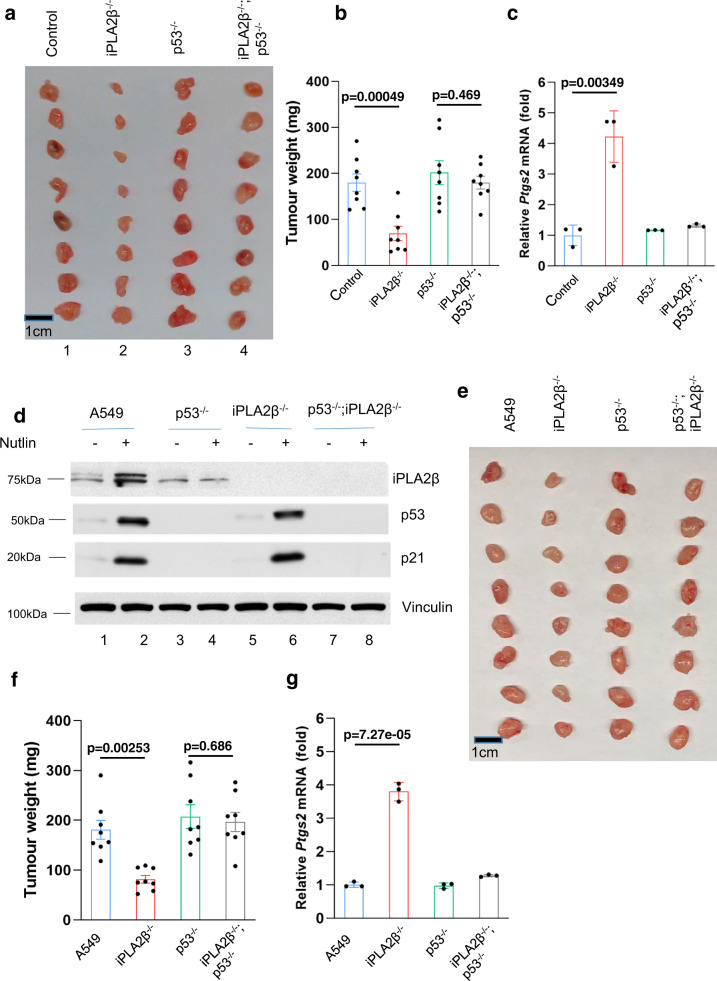
Fig. 6. iPLA2β acts as a major suppressor of p53-mediated tumor suppressor.
a Xenograft tumors from A375 CRISPR control, iPLA2β−/−, p53−/− or p53−/−; iPLA2β−/− cells as indicated. b Tumor weights were determined from (a) (error bars, from eight tumors). The experiments were repeated twice independently with similar results and representative data were shown. p = 0.00049 for control versus iPLA2β−/−; p = 0.469 for p53−/− versus iPLA2β−/−; p53−/−. c qPCR of Ptgs2 mRNA from tumors harvested in (a). p = 0.00349 for control versus iPLA2β−/−. d A549 cells (Lanes 1, 2), p53−/− cells (lanes 3, 4), iPLA2β−/− cells (lanes 5, 6), or p53−/−; iPLA2β−/− cells (lanes 7, 8) treated with Nutlin 10 µM for 24 h (lanes 2, 4, 6, 8) versus control (lanes 1, 3, 5, 7) by the antibodies to iPLA2β, p53, p21or actin. The experiments were repeated twice, independently, with similar results. e Xenograft tumors from A549 CRISPR control, iPLA2β−/−, p53−/− or p53−/−; iPLA2β−/− cells as indicated. f Tumor weights were determined from (e) (error bars, from eight tumors). The experiments were repeated twice independently with similar results and representative data were shown. p = 0.00253 for A549 versus iPLA2β−/−; p = 0.686 for p53−/− versus iPLA2β−/−; p53−/−. g qPCR of Ptgs2 mRNA from tumors harvested in (e). p = 0.00000727 for A549 versus iPLA2β−/−. b, f Error bars are mean ± SEM. c, g Error bars are mean ± s.d., b–c, f–g n = 8 biologically independent samples. All p values were calculated using two-tailed unpaired Student’s t-test. Detailed statistical tests are described in the ‘Methods’. Source data are provided as a Source Data file.

