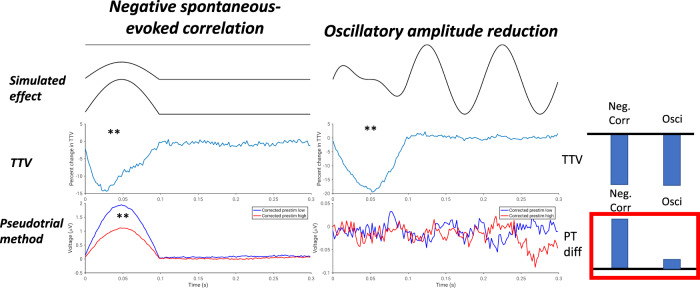
Fig. 4. Results of simulation to disentangle methodological inconsistencies of Fig. 3.
In each column, a schematic of the simulated effect is plotted (“simulated effect”), along with the normalized trial-to-trial SD (“TTV”), and the results following application of the method of pseudotrials (“pseudotrial method”). *p < 0.05, **p < 0.01. Bars at the right show a schematic of the results: both simulations show a decrease in TTV, but only the simulation with a genuine correlation between spontaneous and evoked activity shows a difference with the method of pseudotrials. N = 48 simulated participants.

