Figure 3.

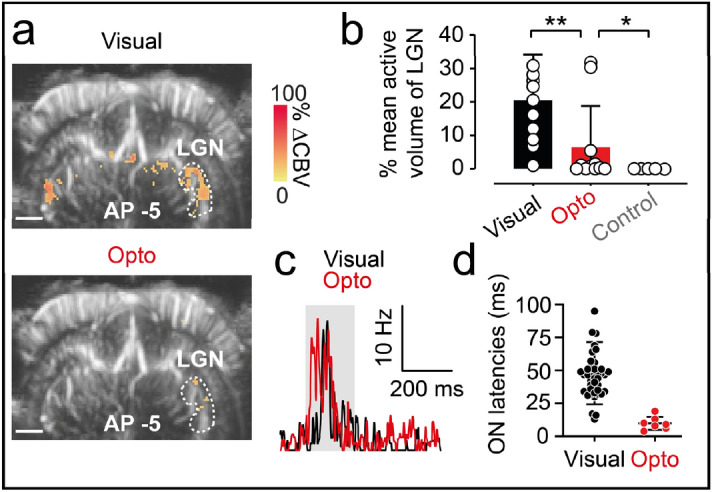
Spread of optogenetic activation to the LGN. (a) fUS activation maps obtained during visual stimulation of the contralateral eye (top) and optogenetic stimulation of the ChrimsonR-expressing ipsilateral V1 area (bottom) from a single imaging plane in which the LGN is present (AP − 5 mm) from the same animal. White dashed lines delimit the ipsilateral LGN. Scale bar: 2 mm. (b) Percentage active volume of the LGN after visual, optogenetic or control stimulation. For both visual and optogenetic stimulations, we show the volumes of the LGN ipsilateral to the injection, whereas, for control stimulations, the volume of the contralateral LGN is shown. Open circles represent mean values over all imaging planes for each animal (visual and optogenetic stimulation, n = 11, Wilcoxon signed-rank test, one-tailed, p = 0.0068, n = 5 for control, Mann–Whitney test, one-tailed, p = 0.0288), bars represent the mean for all animals. (c) SDF of a typical LGN single unit responding to visual (black line) and optogenetic (red line) stimulation of the ipsilateral V1 area. (d) ON latencies of V1 and LGN single-unit responses to visual (V1, n = 33 units, LGN, n = 42 units) or optogenetic stimulation of V1 (V1, n = 29 units, LGN, n = 7 units. Mann–Whitney test, p < 0.05). The irradiance used for optogenetic and control stimulation was 142 mW mm−2.
