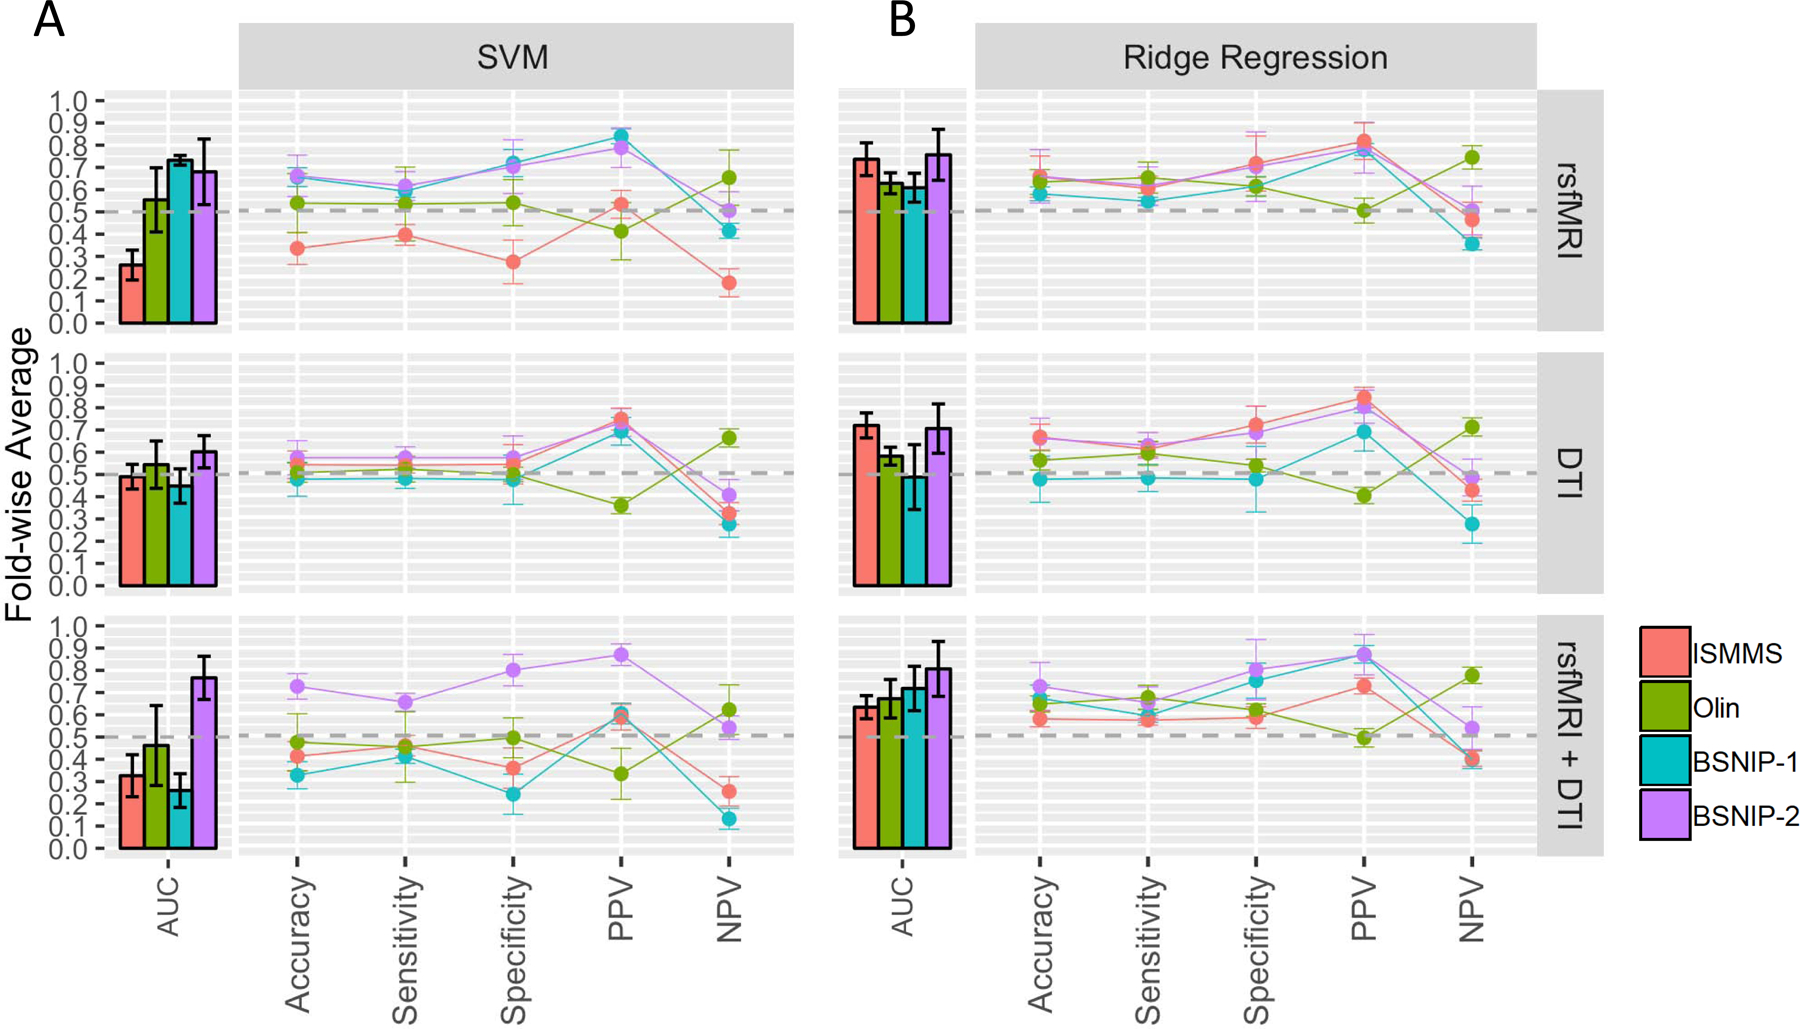
Figure 2. Within Sample Classification Results: Non-Residualized Features.

A. Performance profiles for the SVM algorithm and each feature modality. Colors correspond to samples. Bars show AUC (overall algorithm performance), while lines show point estimates from the midpoint of the ROC curve. Values on the y-axis are average values over 5 folds and error bars represent the standard deviation over folds. Values are for models using non-residualized features. Results for models using residualized features are shown in Supplementary Figure 5A and are largely similar. B. Same as A. but for ridge regression. Results for models using residualized features are shown in Supplementary Figure 5B. rsfMRI=resting state functional MRI, DTI=Diffusion Tensor Imaging, PPV=Positive Predictive Value, NPV=Negative Predictive Value, AUC=Area Under the Curve.
